Model Setup
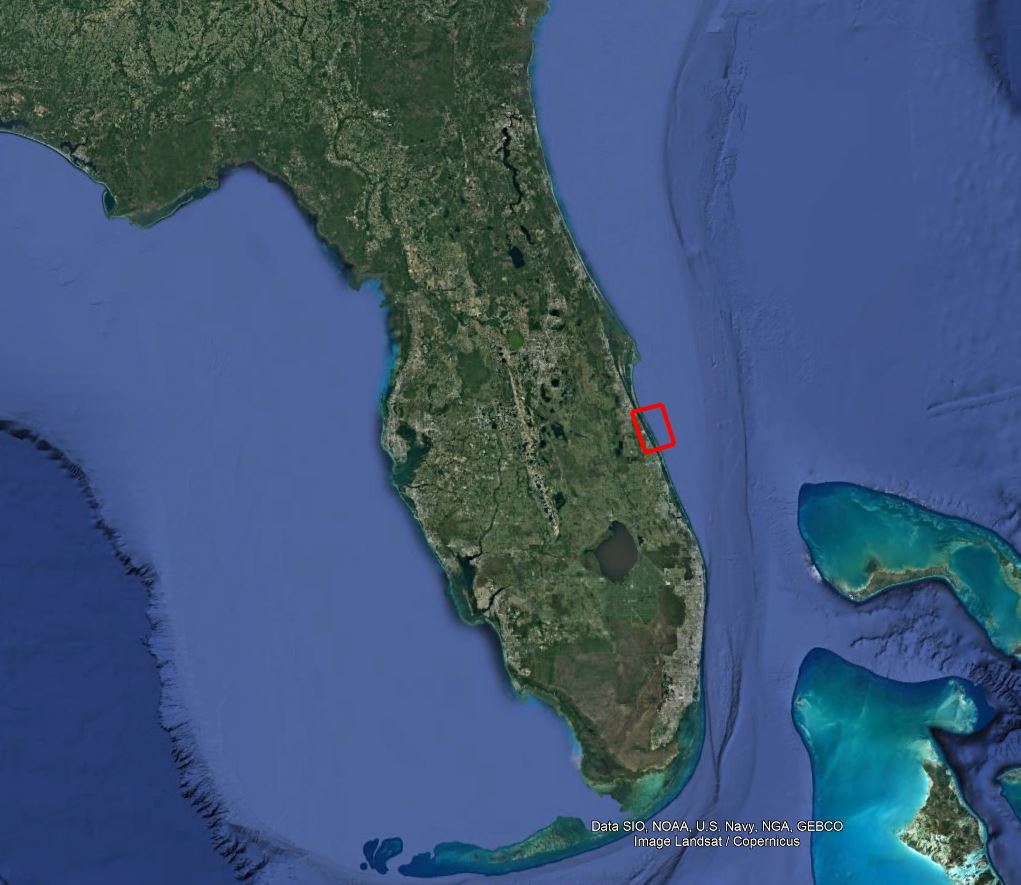
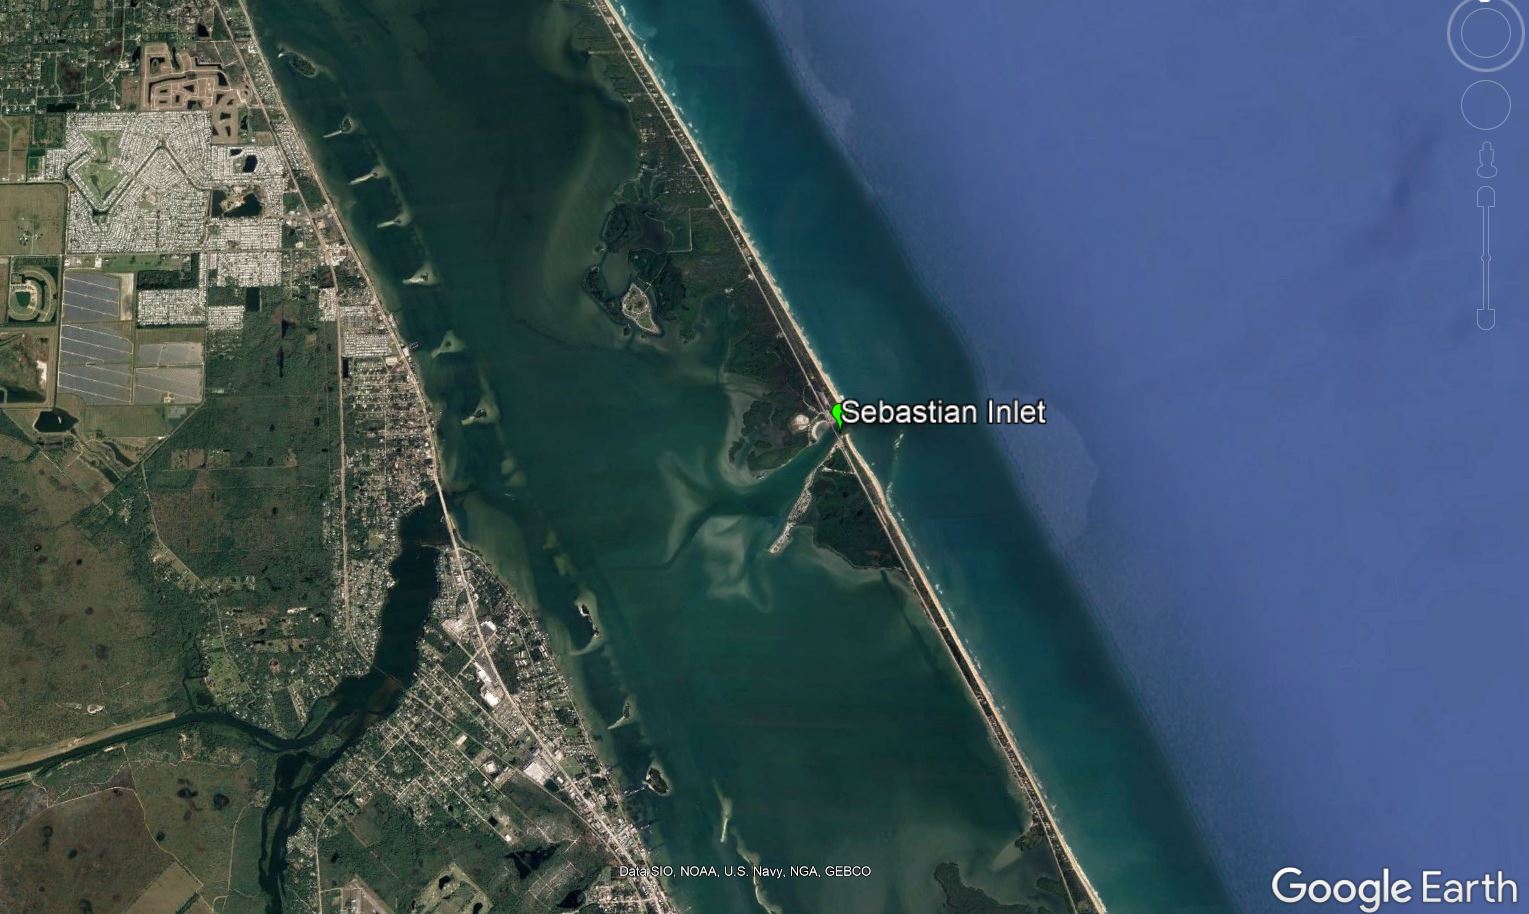
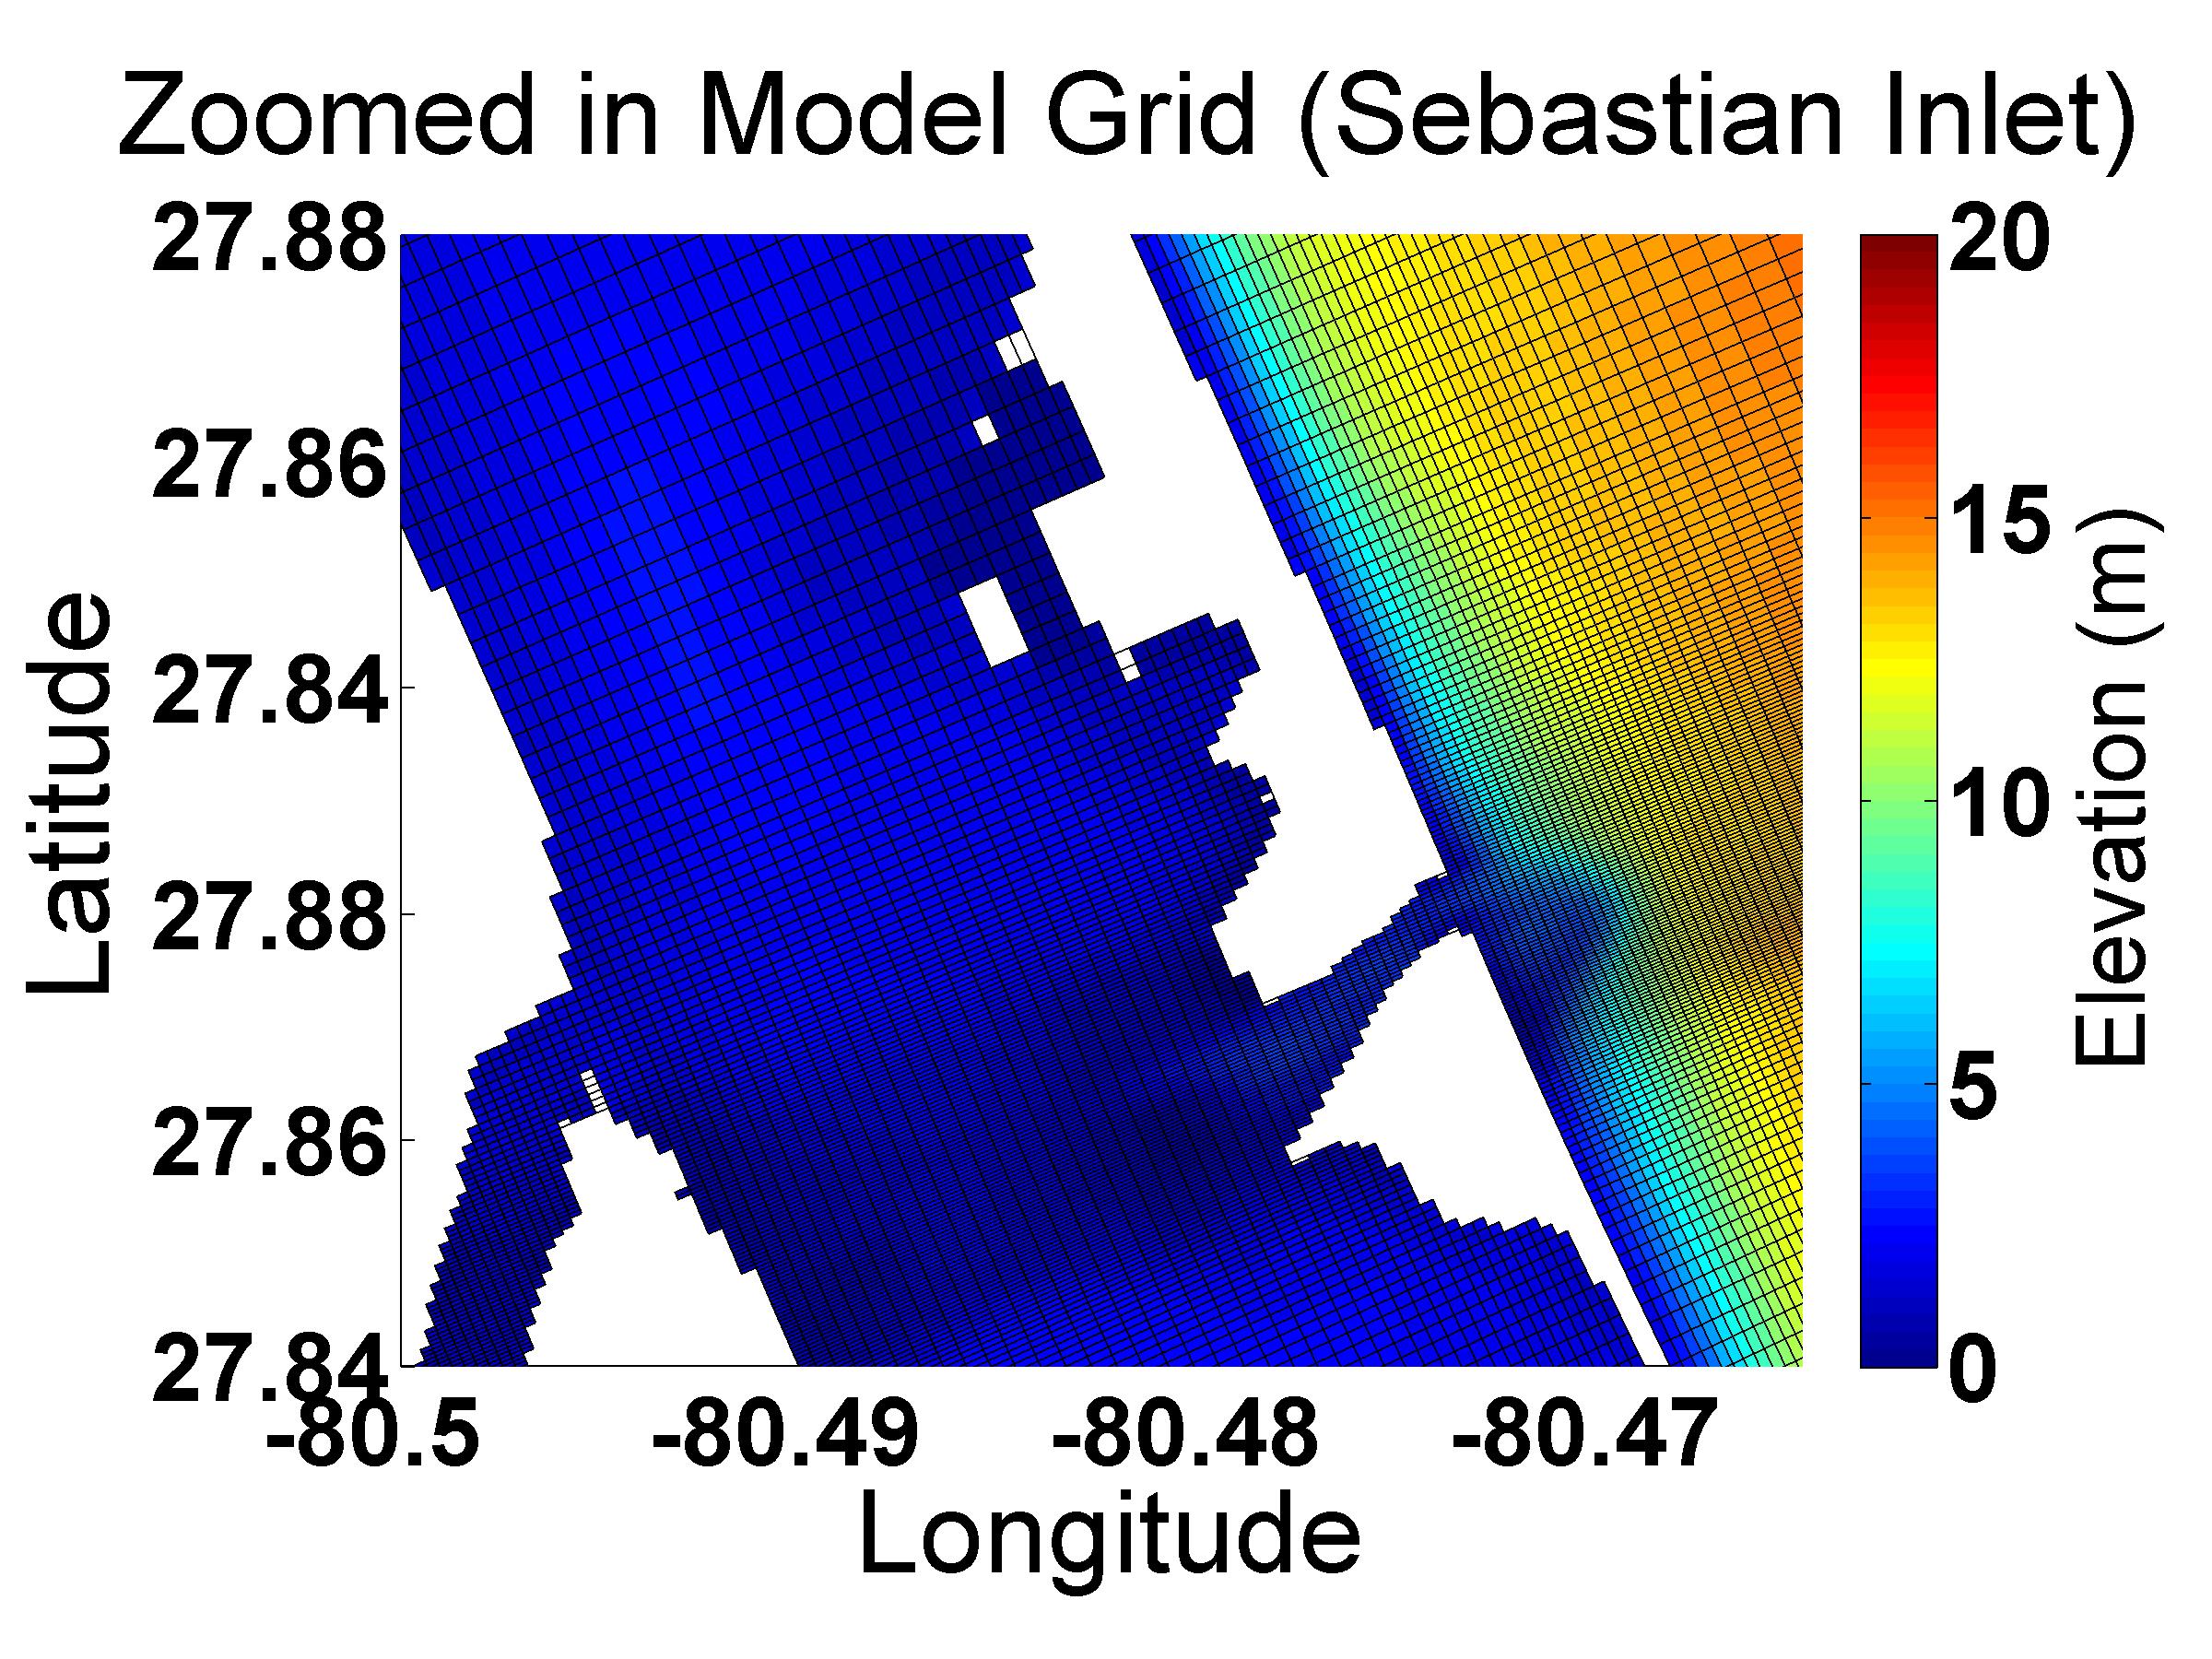
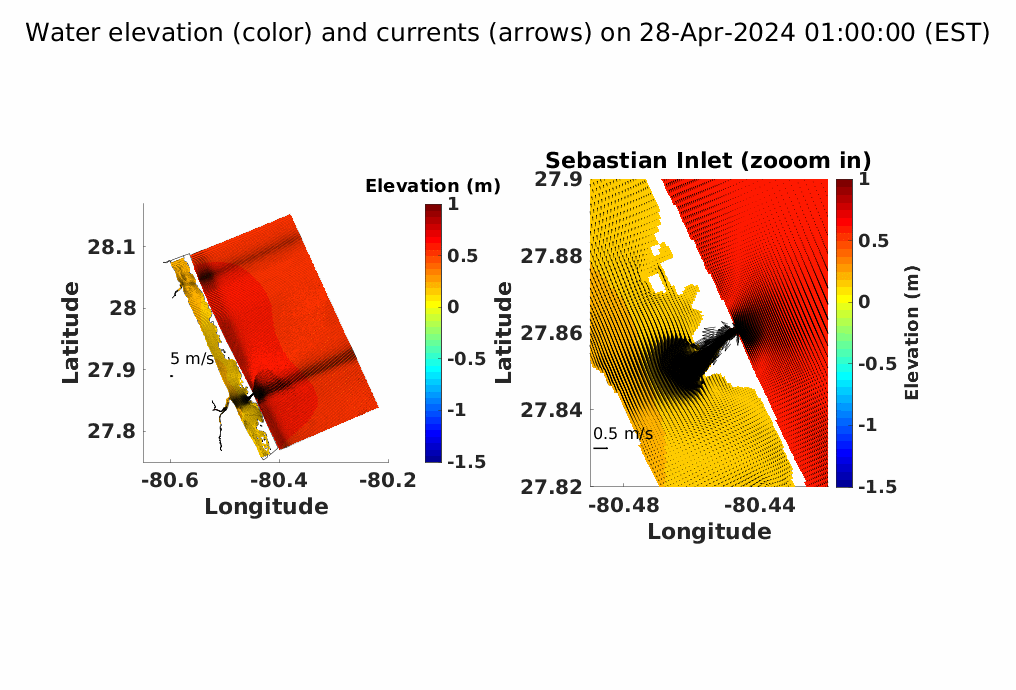
A numerical model has been developed using Delft3D, a 3-dimensional modeling suite for hydrodynamics, sediment transport and morphology, and water quality for estuarine and coastal environments. A curvilinear orthogonal grid was created with grid size ranging from 14 m in the inlet to 475 m in the coastal area and with 5 sigma layers. The grid represents coastline from Wabasso Beach to Indialantic Beach. Wave model was set up using SWAN (Simulating Waves Nearshore) model suite integrated into Delft3D. Same flow grid and bathymetry were used for wave model setup.

Offshore Boundary Conditions
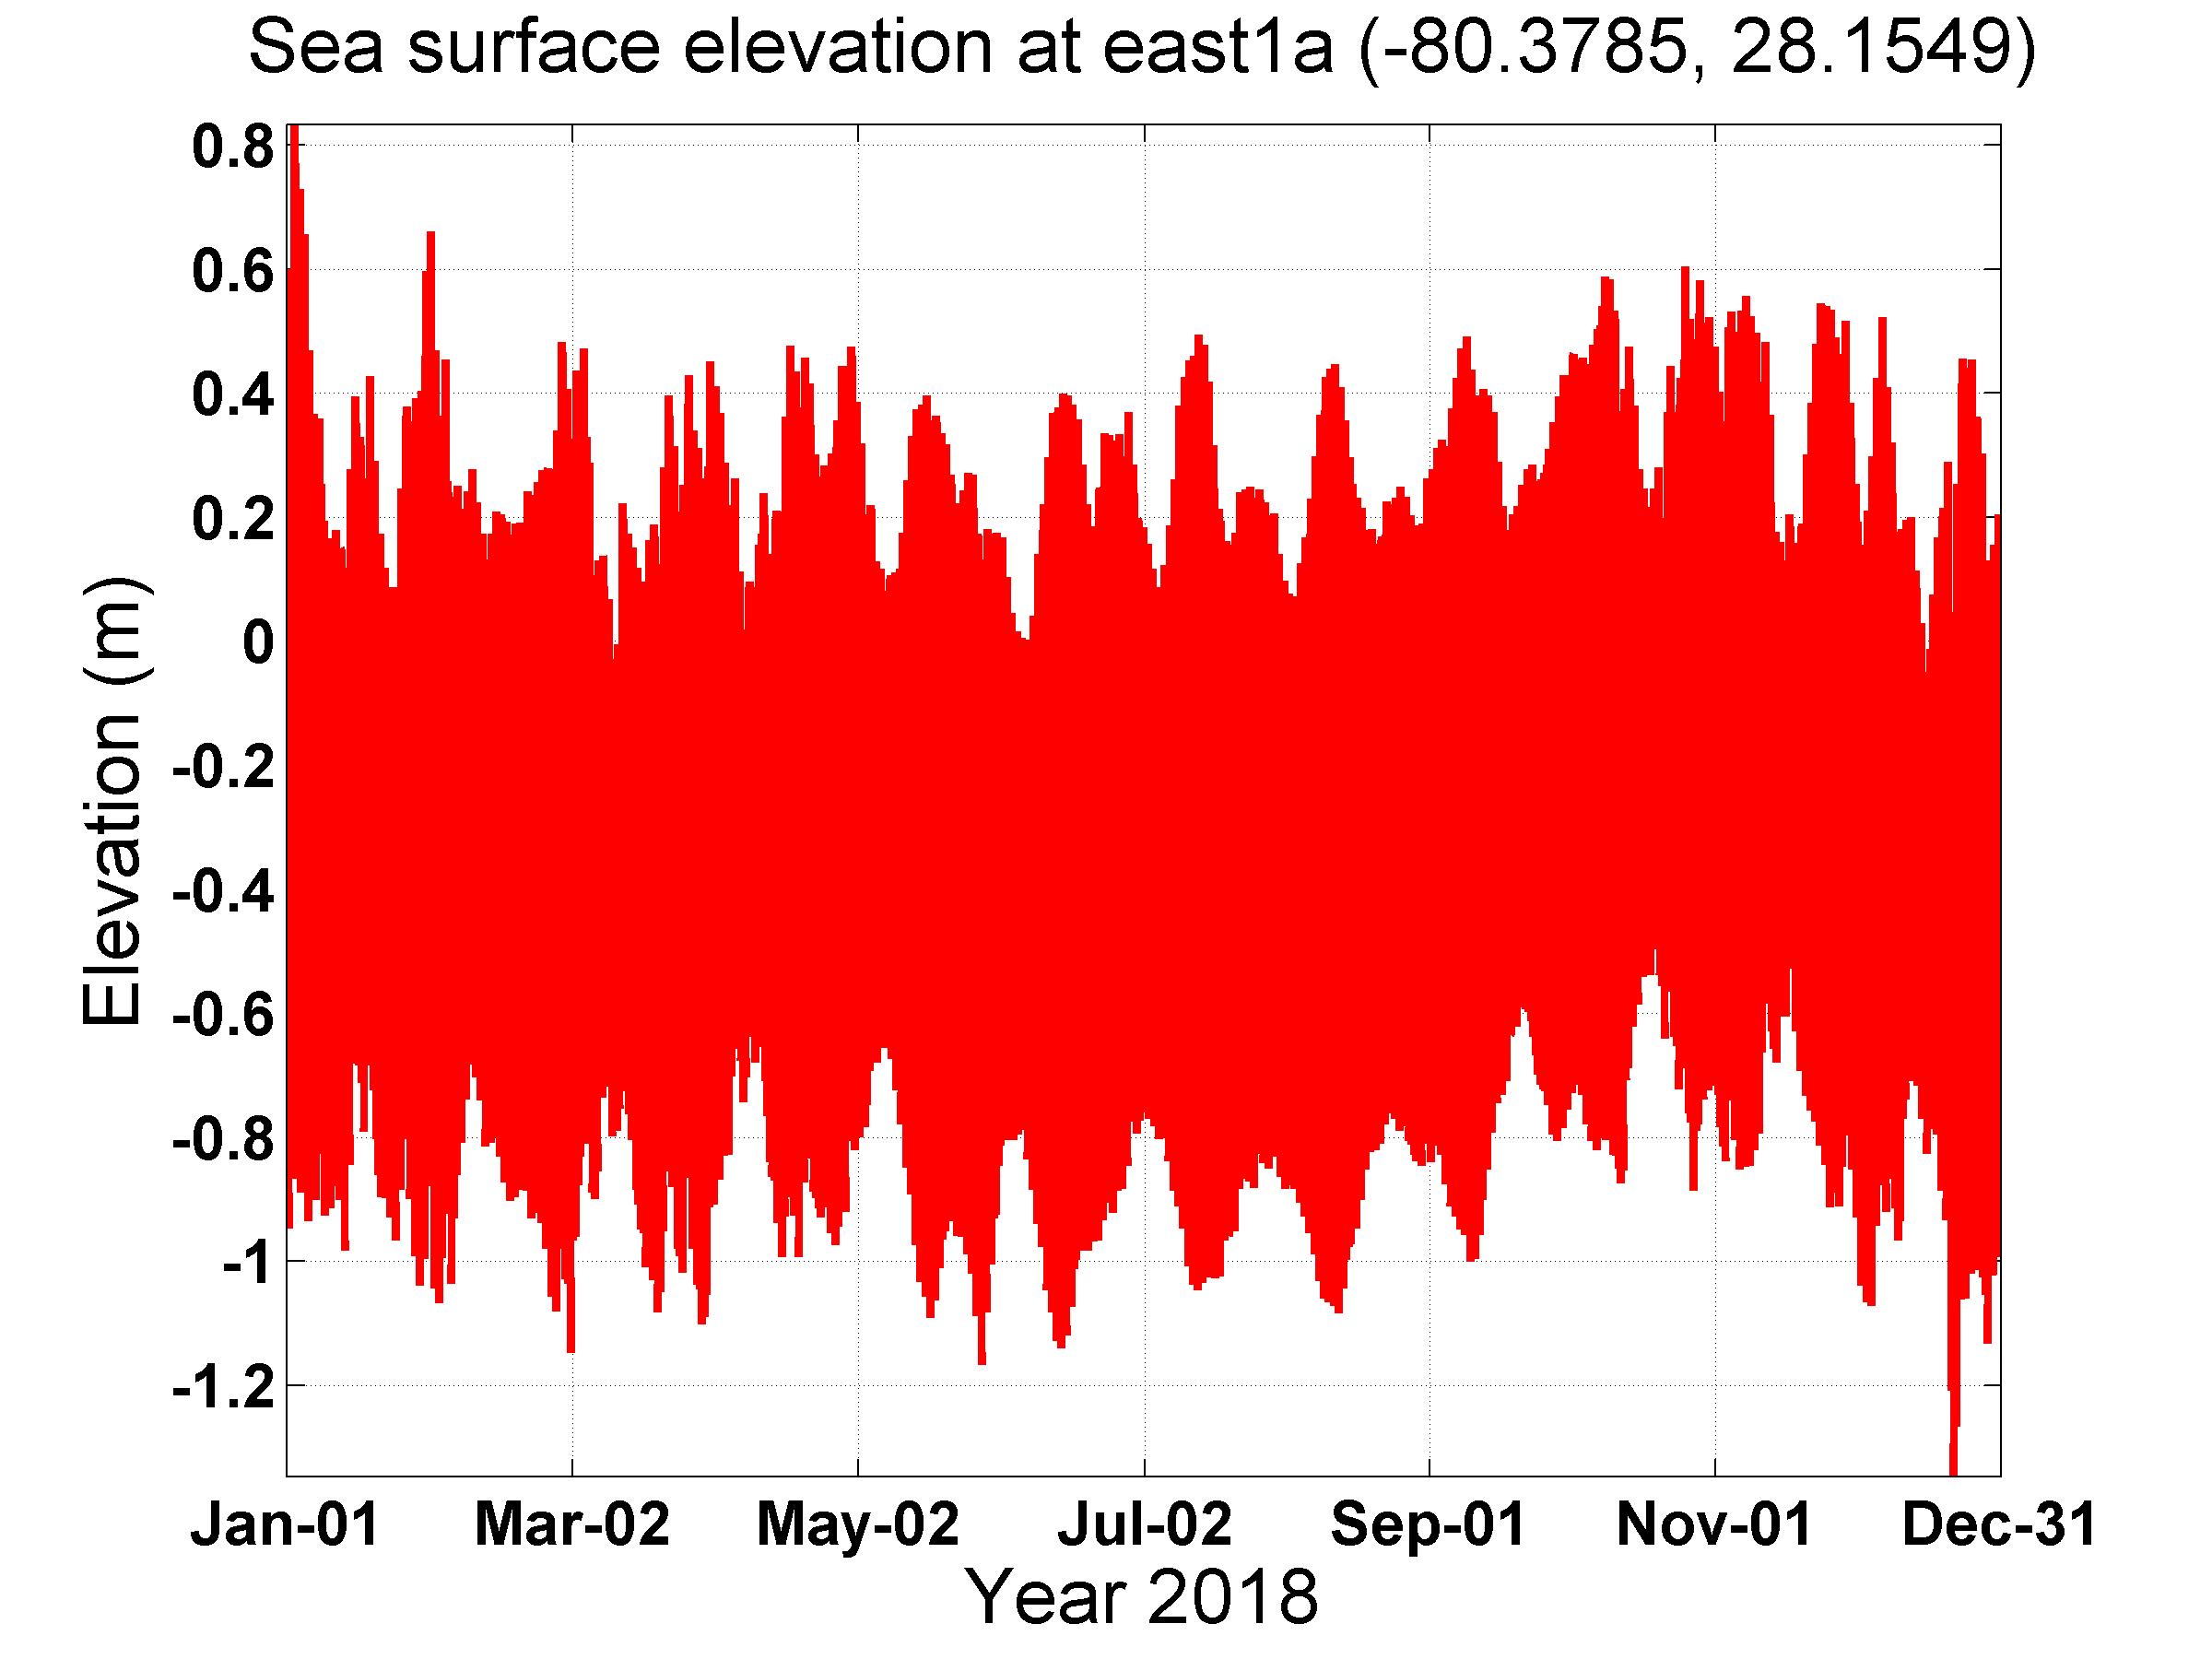
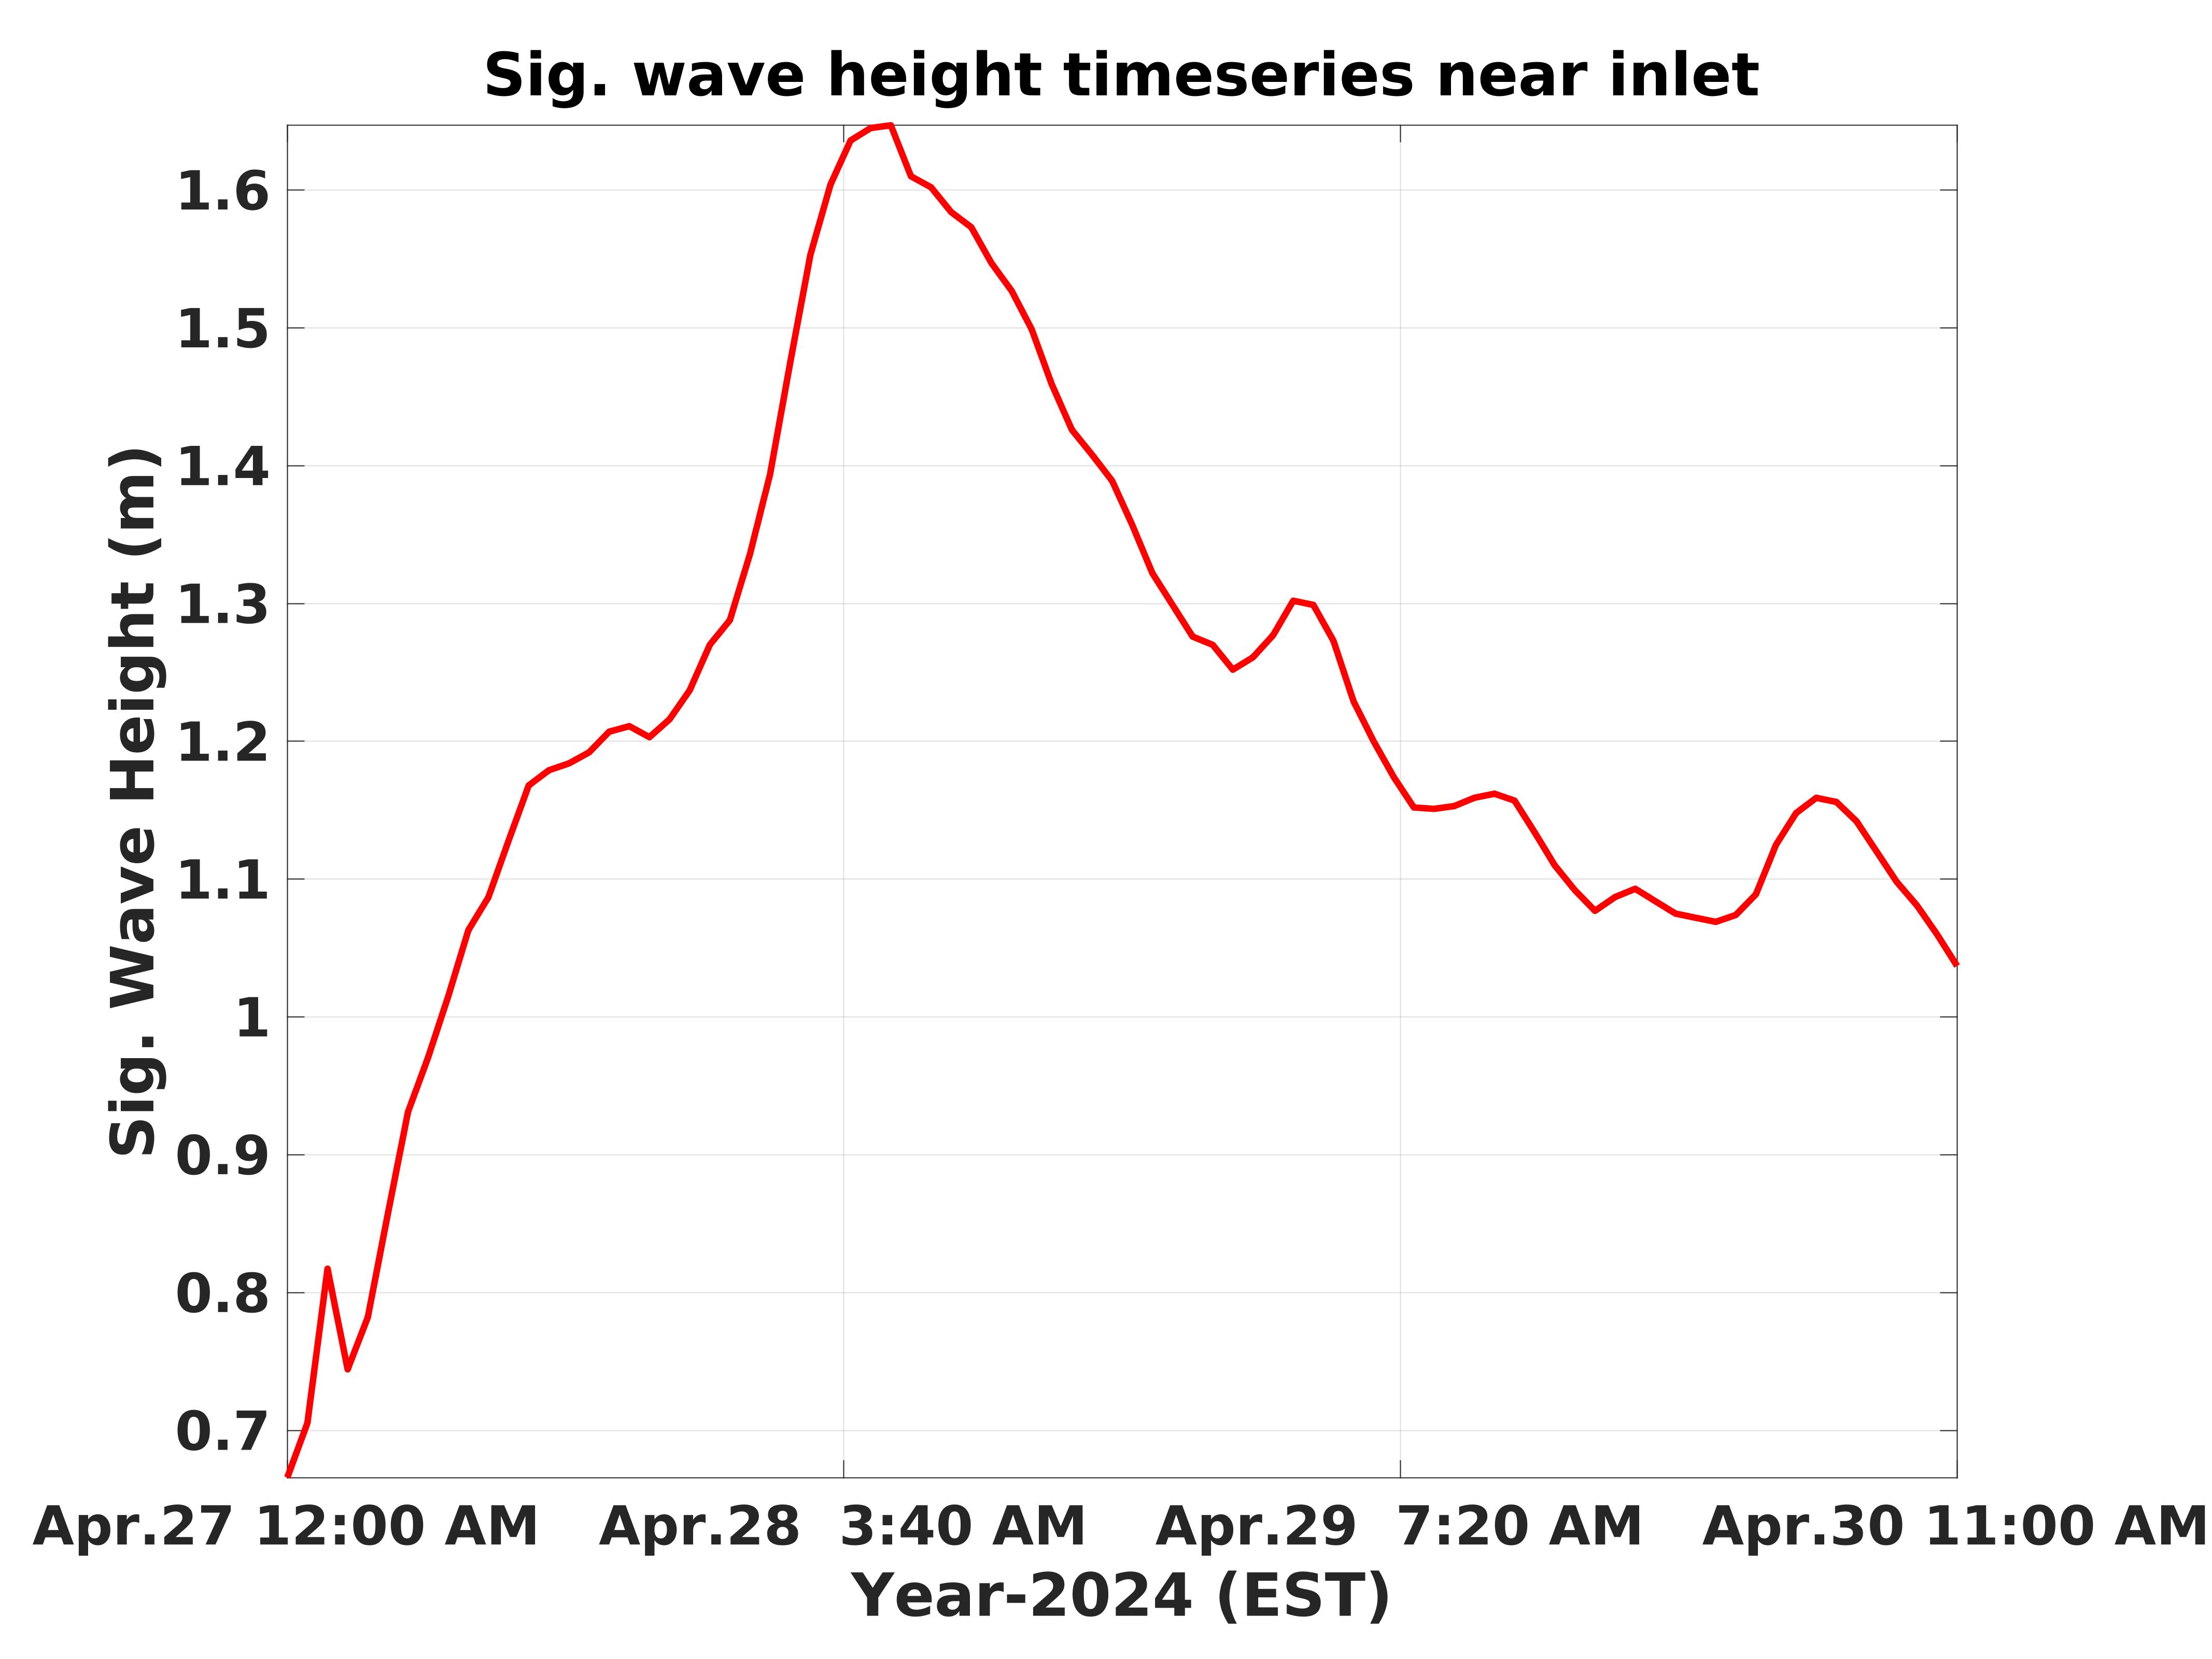
The model is driven by water elevation time series that includes tides and lower frequency sea level oscillations, and meteorological forcing. Temperature, salinity and sea surface elevation along north, south and east open boundaries were derived from HYCOM and NCODA Gulf of Mexico 1/25° Analysis. Meteorological forcing (relative humidity, air temperature, wind forcing, heat flux, evaporation and precipitation) was derived from North American Mesoscale Forecast system (NAM). Open boundary conditions for wave model have been derived from global wave model WavewatchIII. Significant wave height, peak period, wave direction and direction spreading data were derived from WavewatchIII.
Model Validation
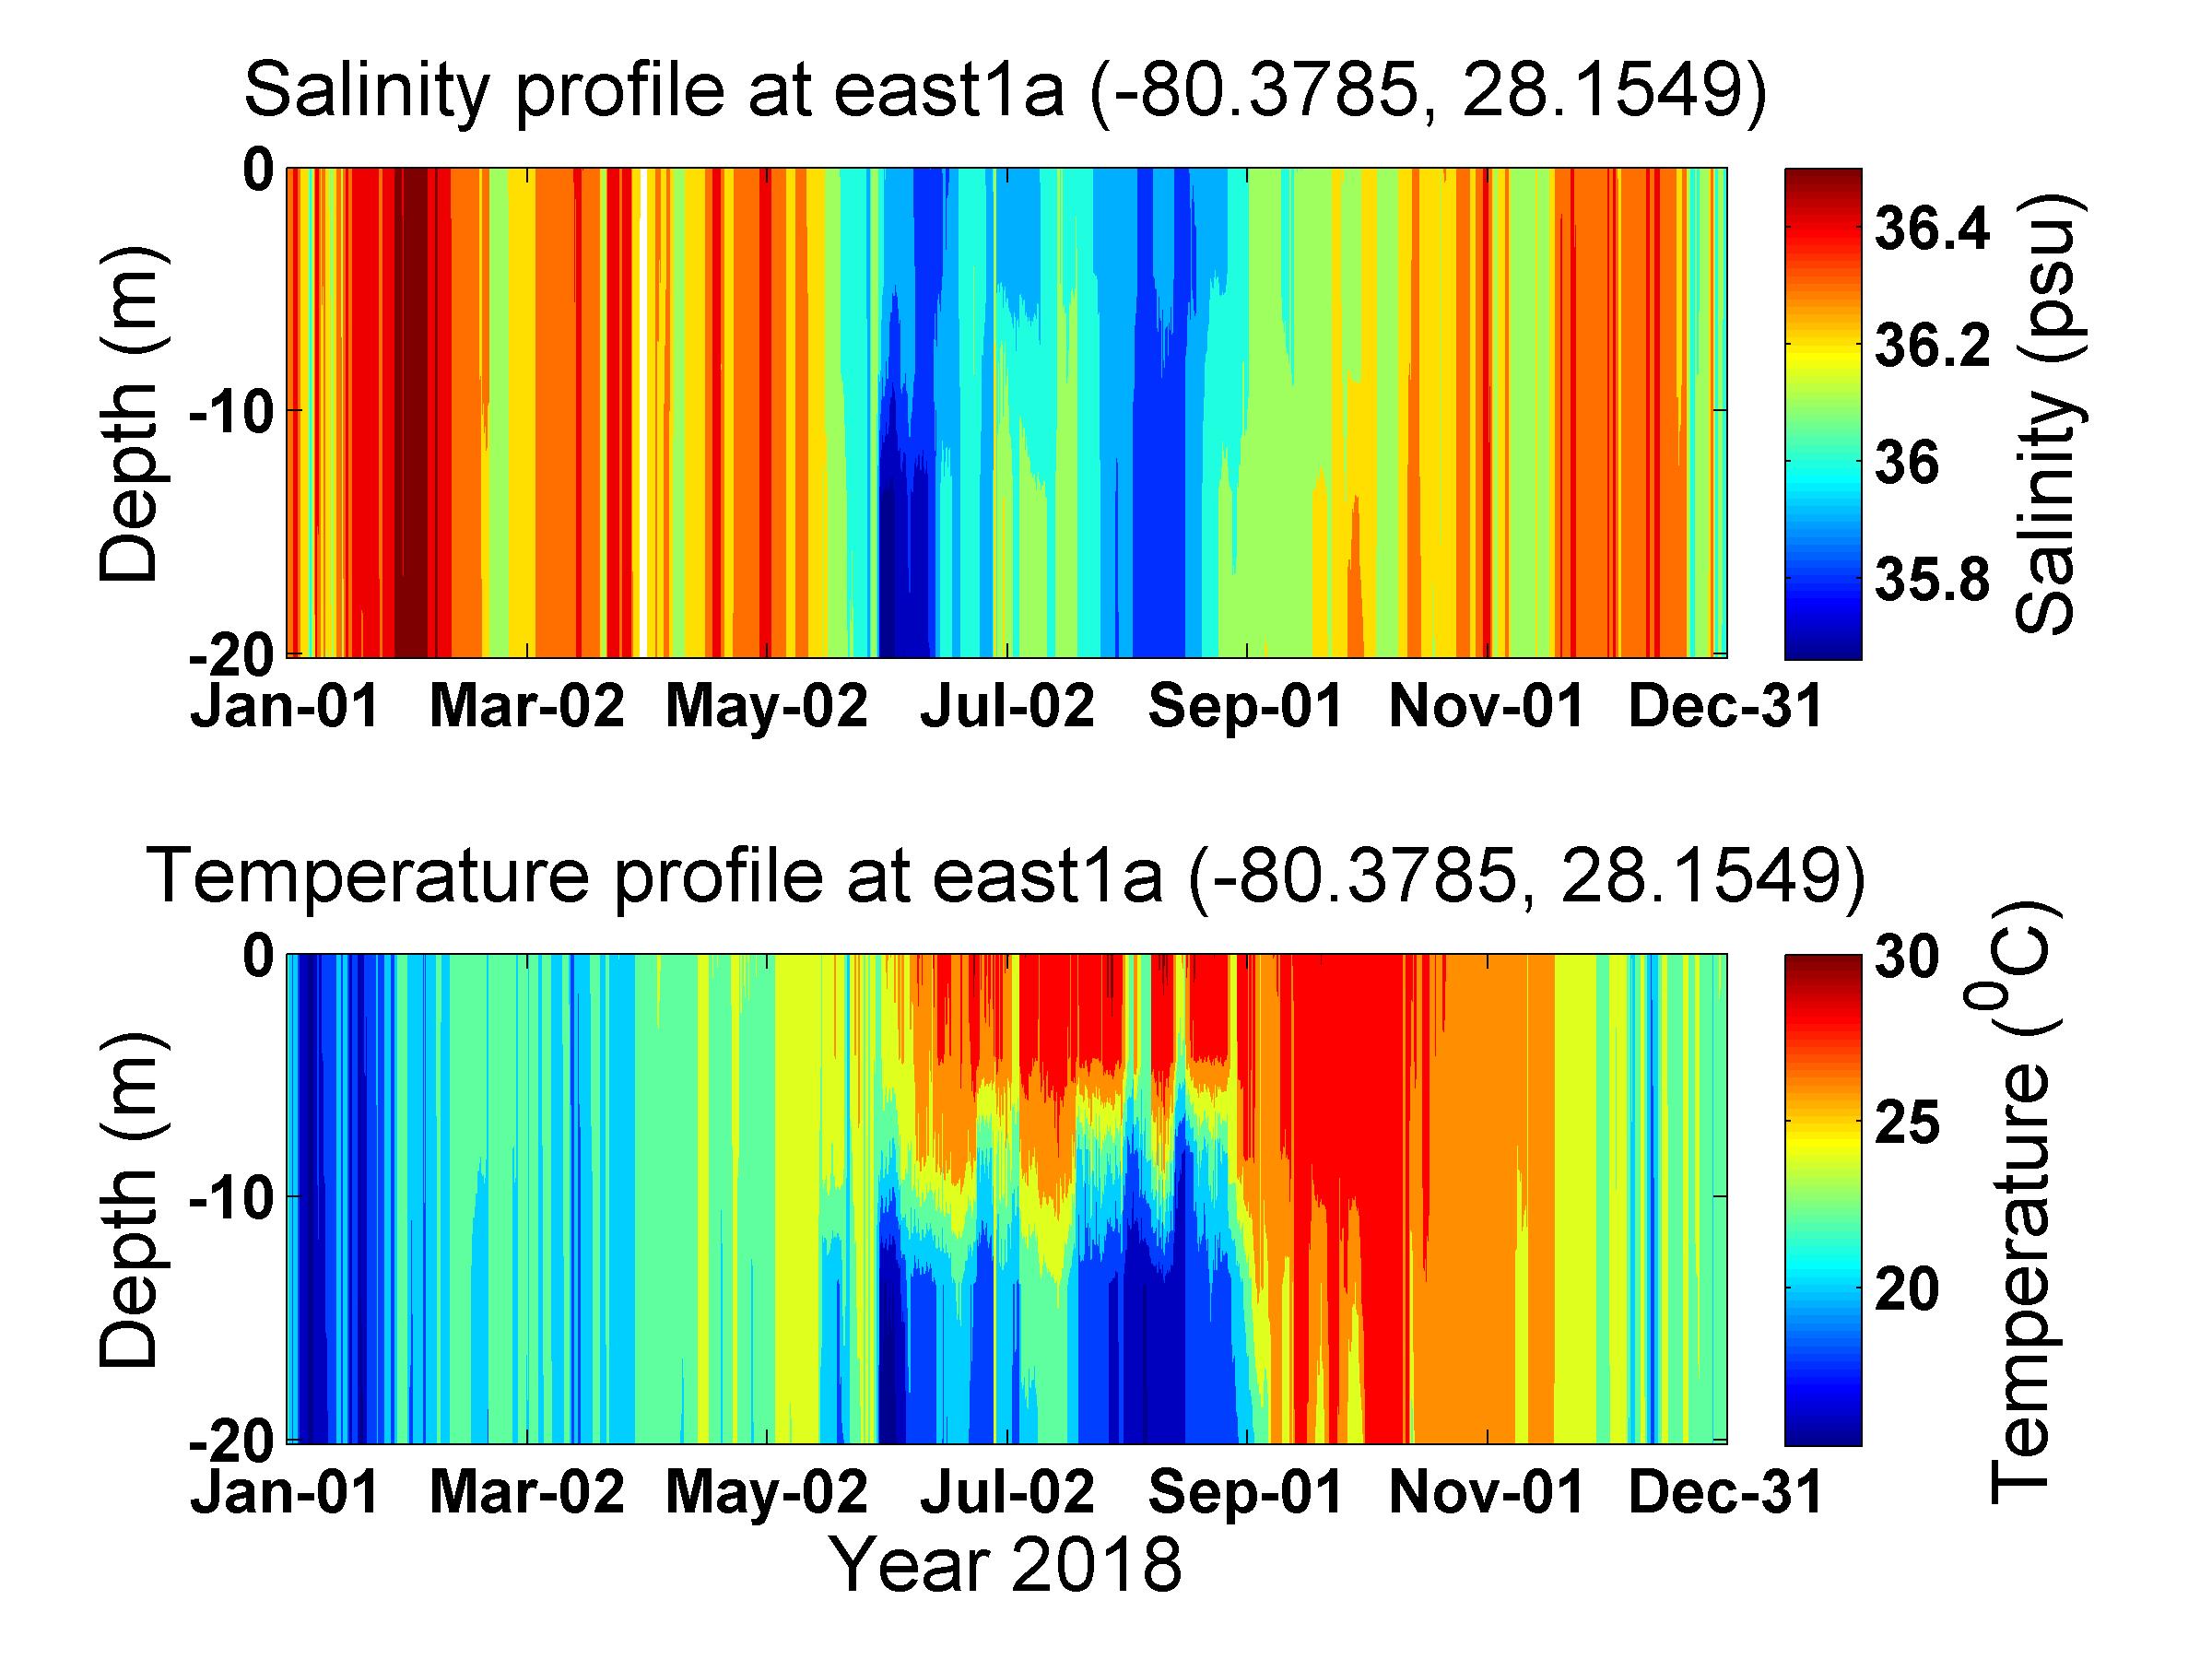
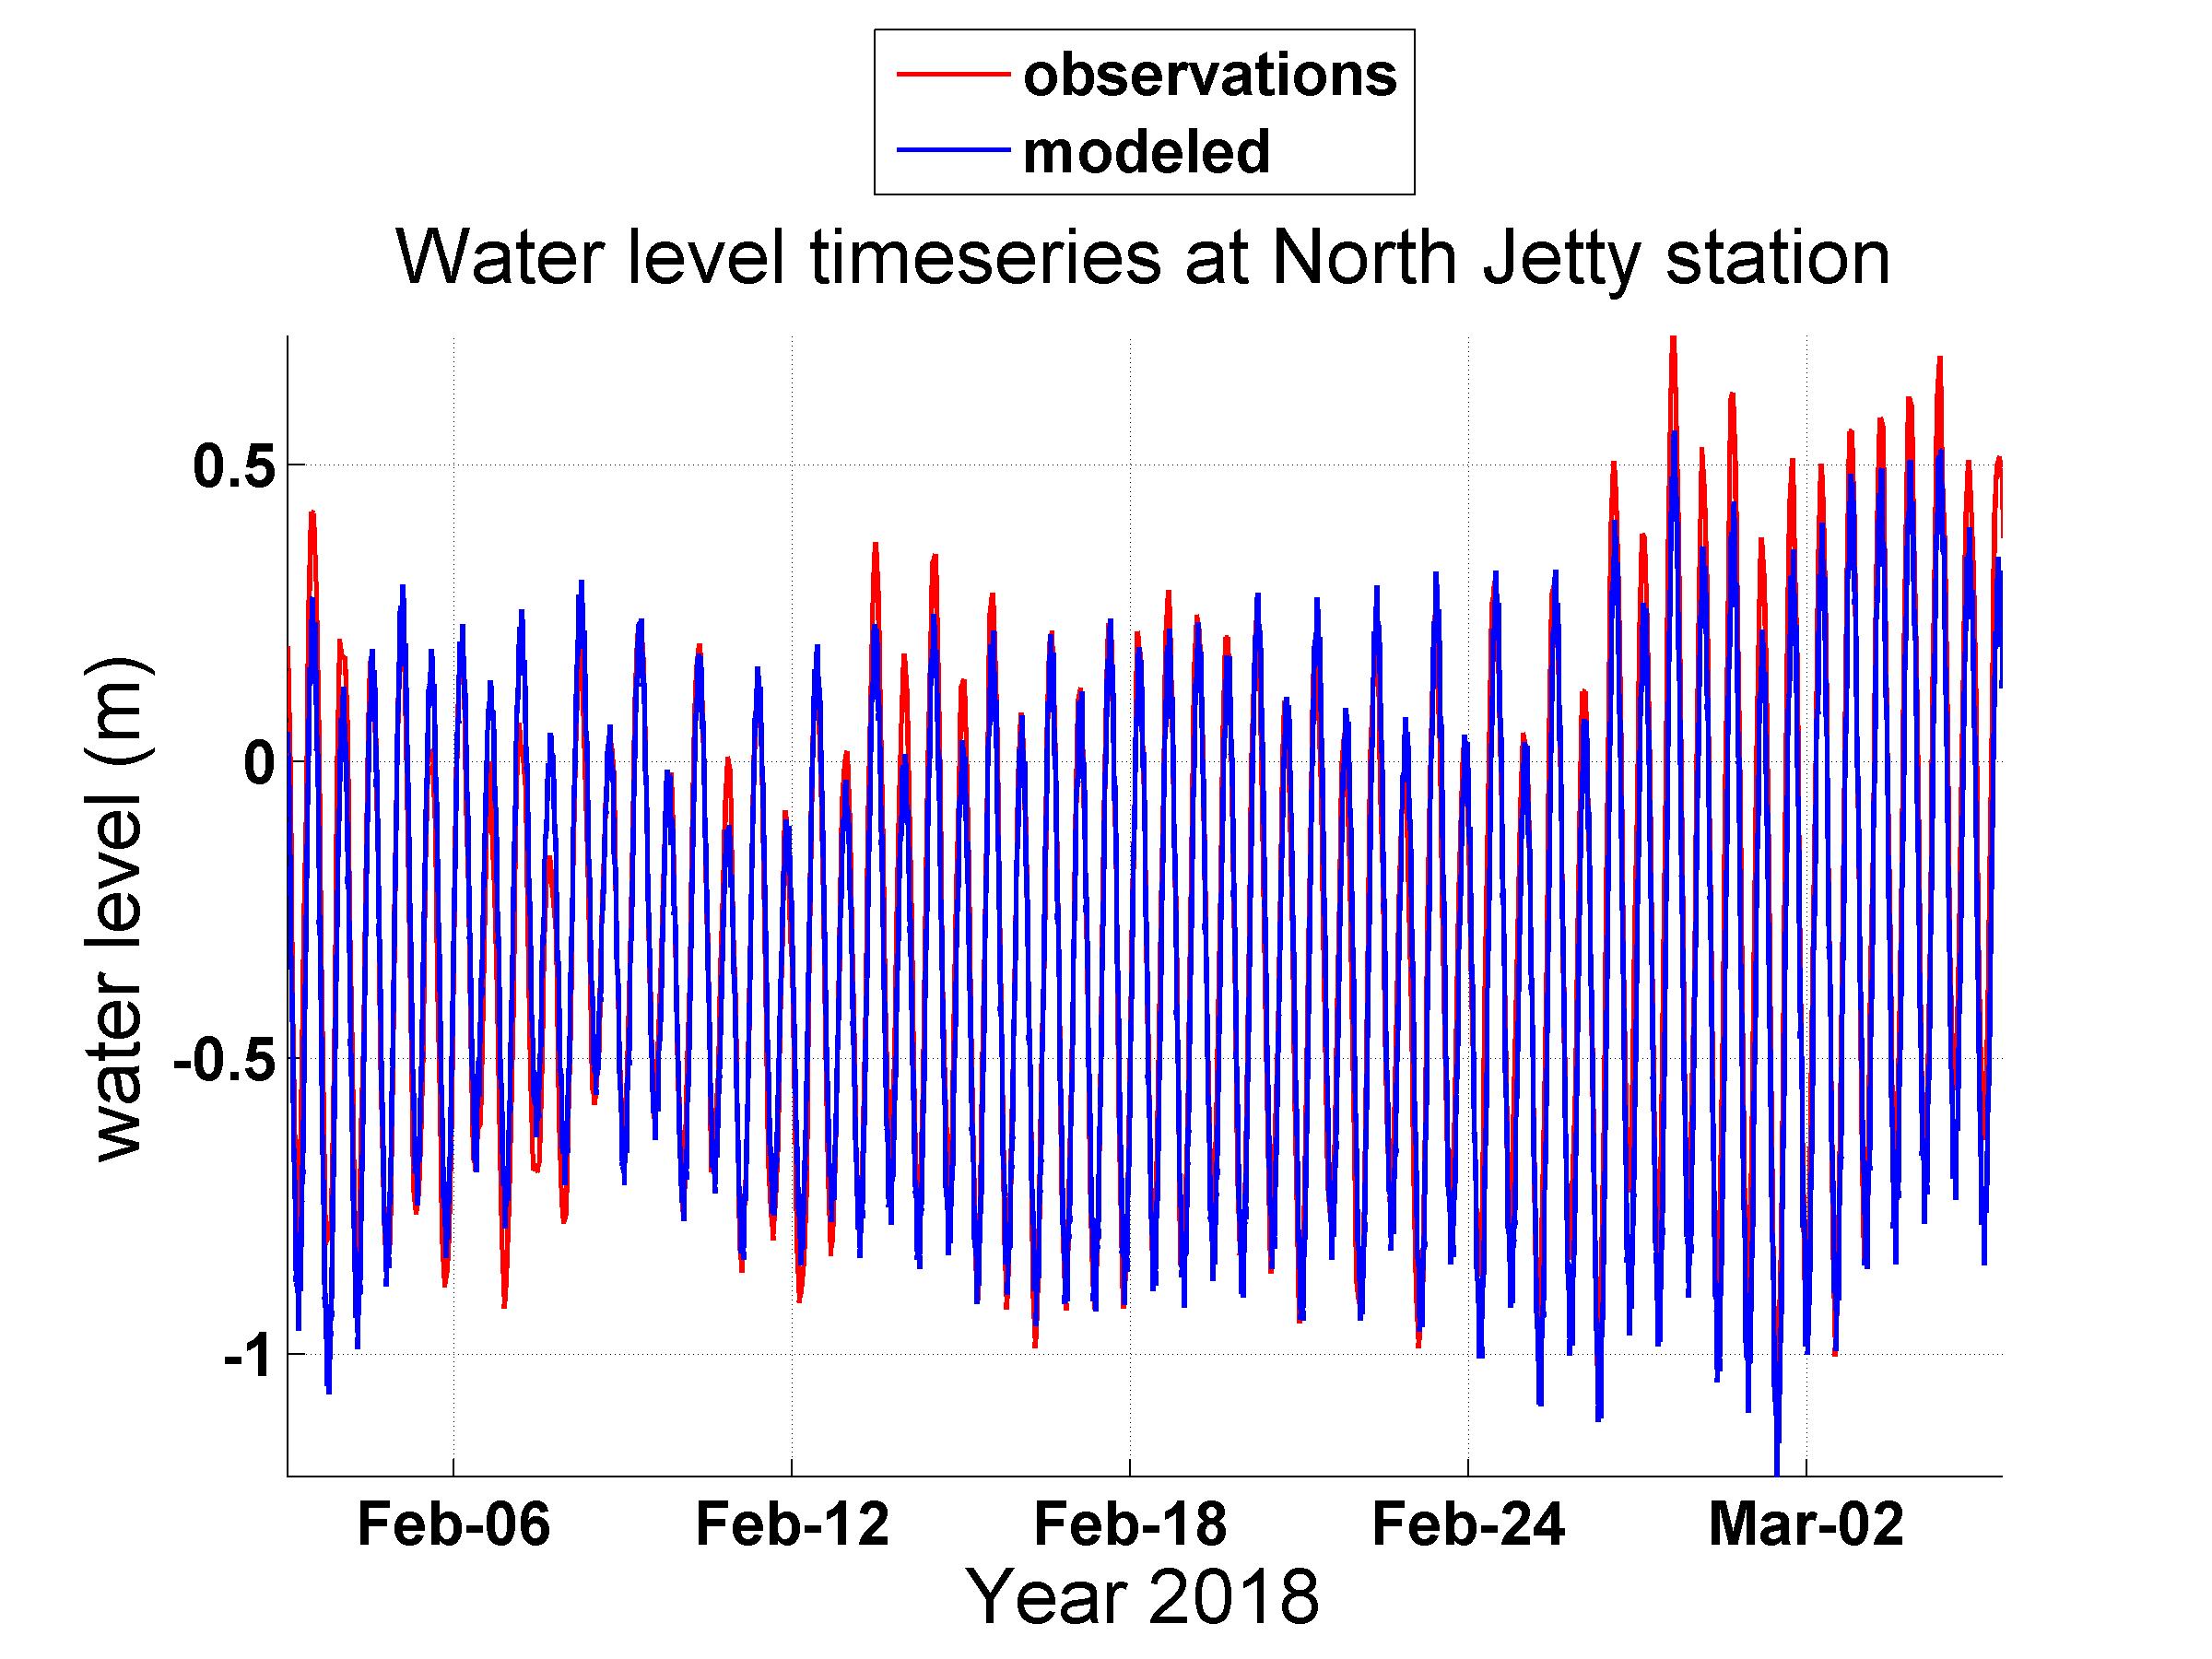
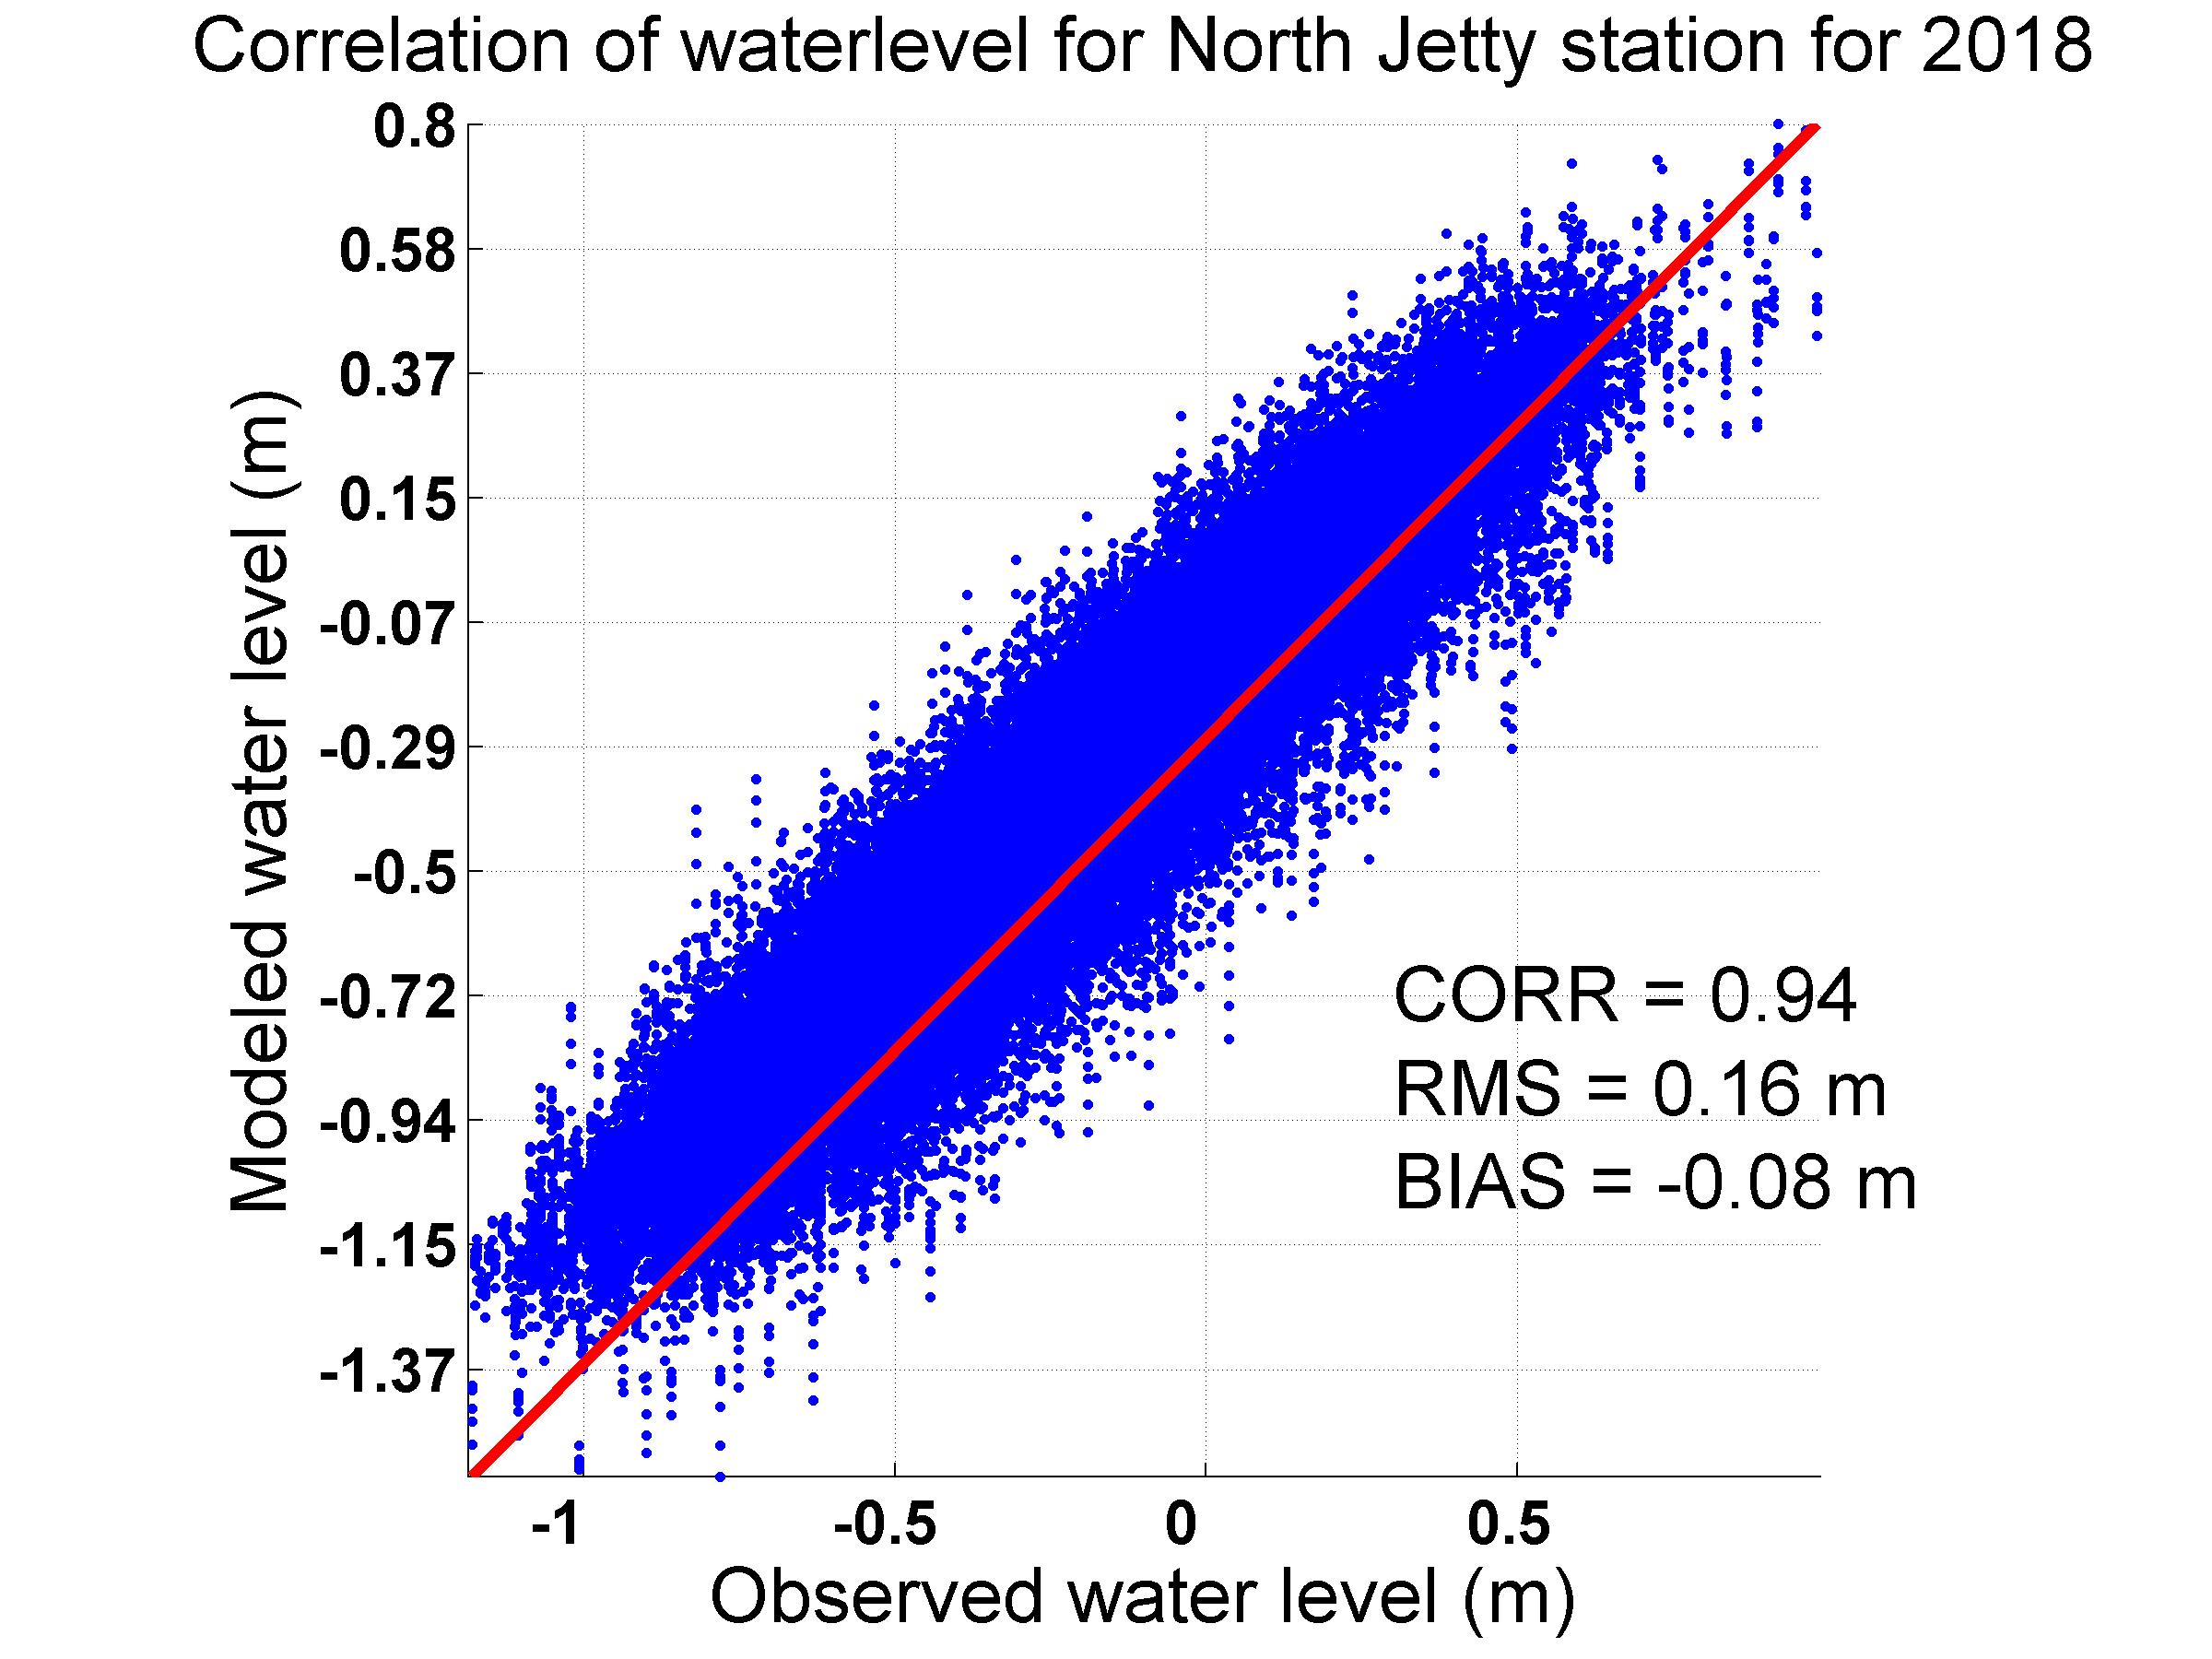
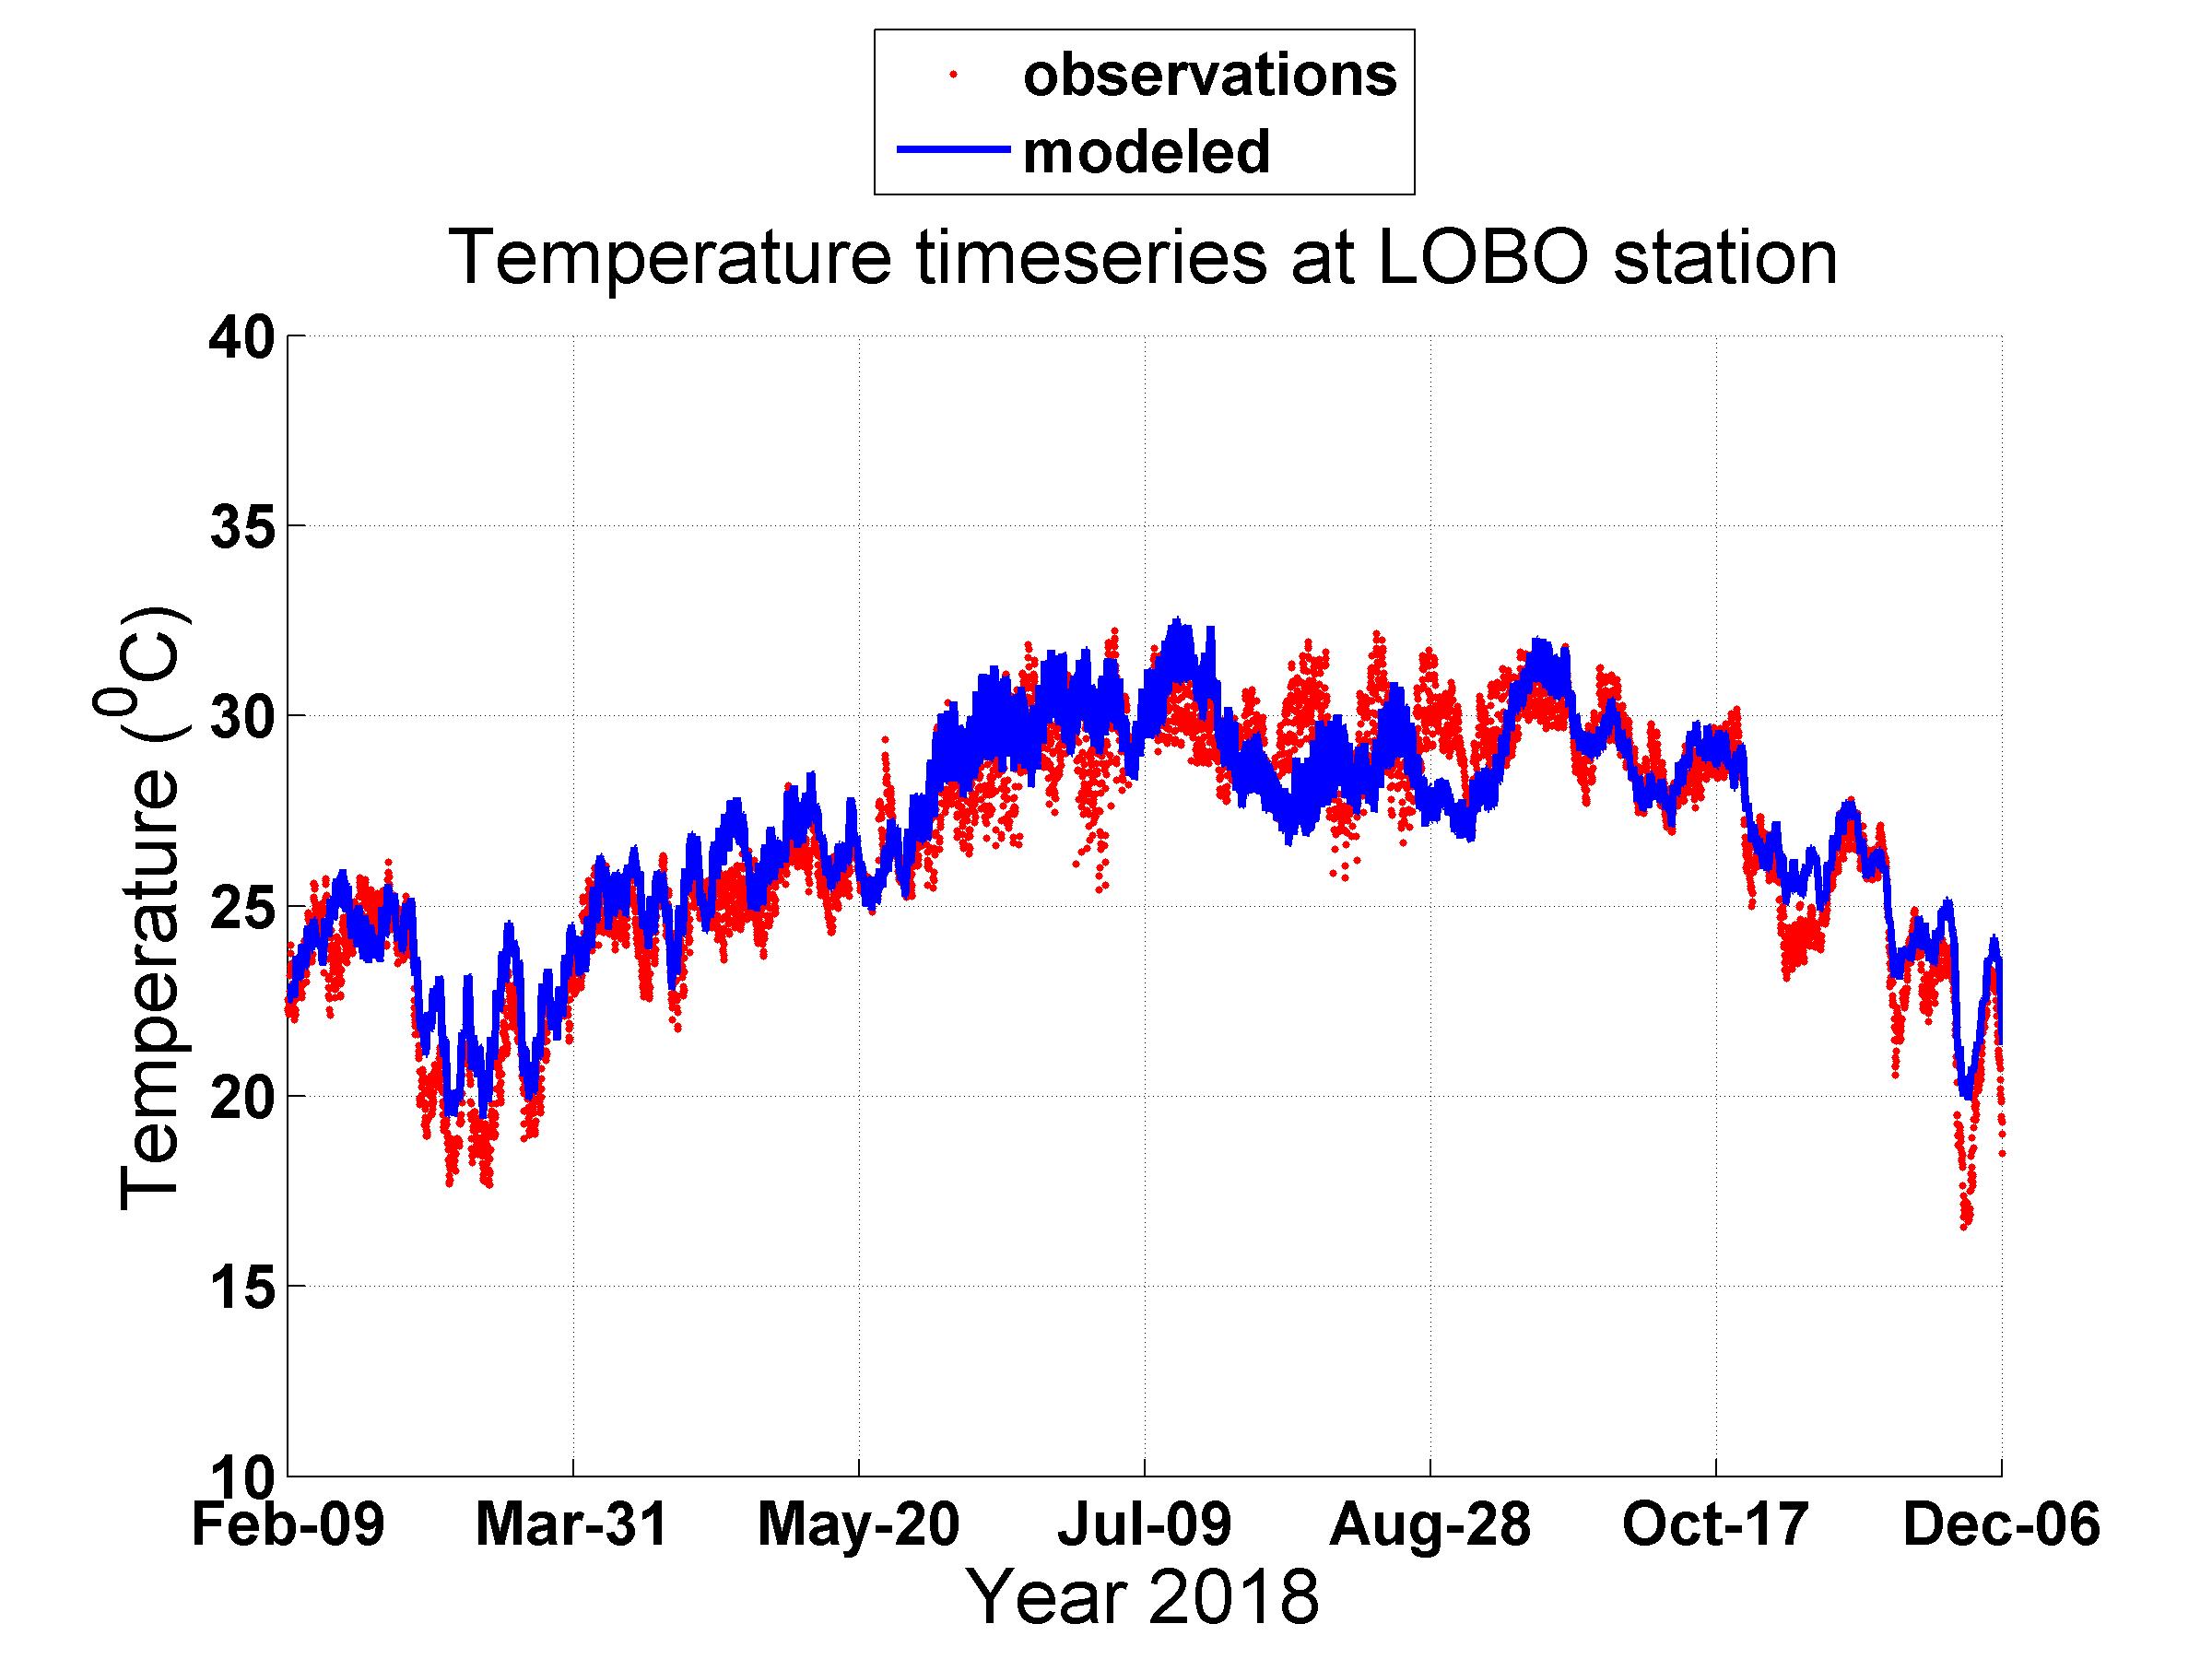
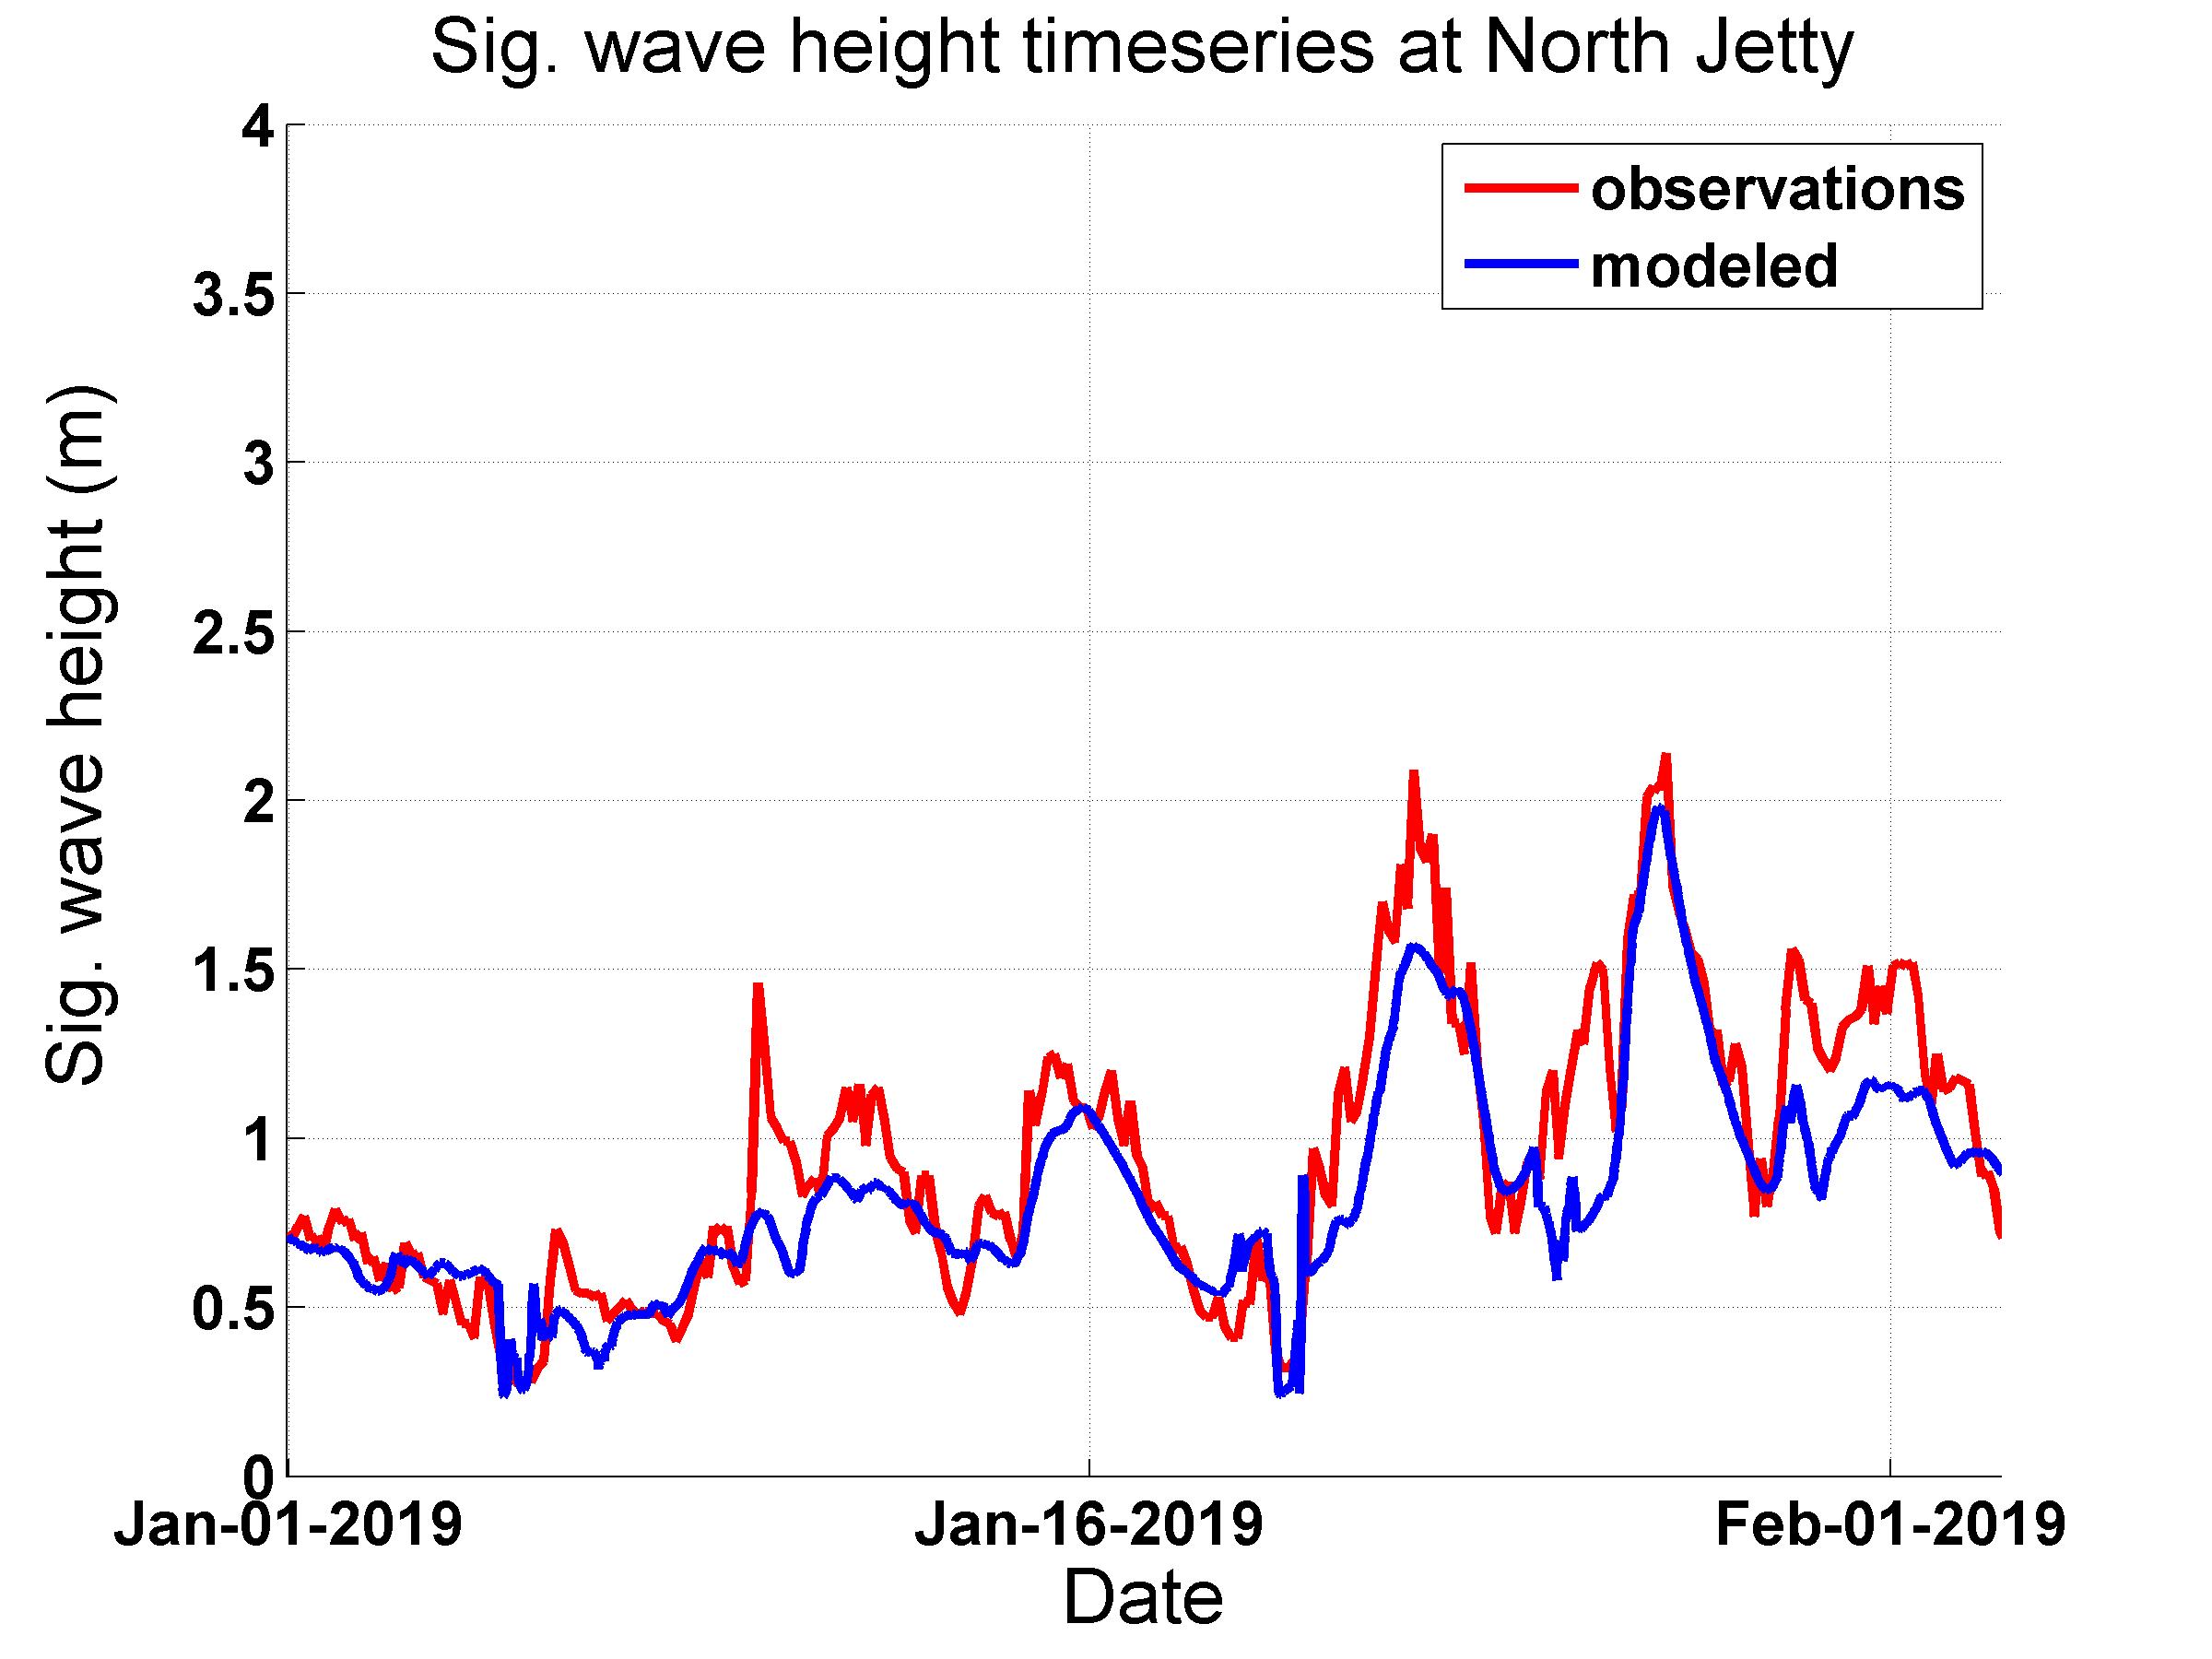
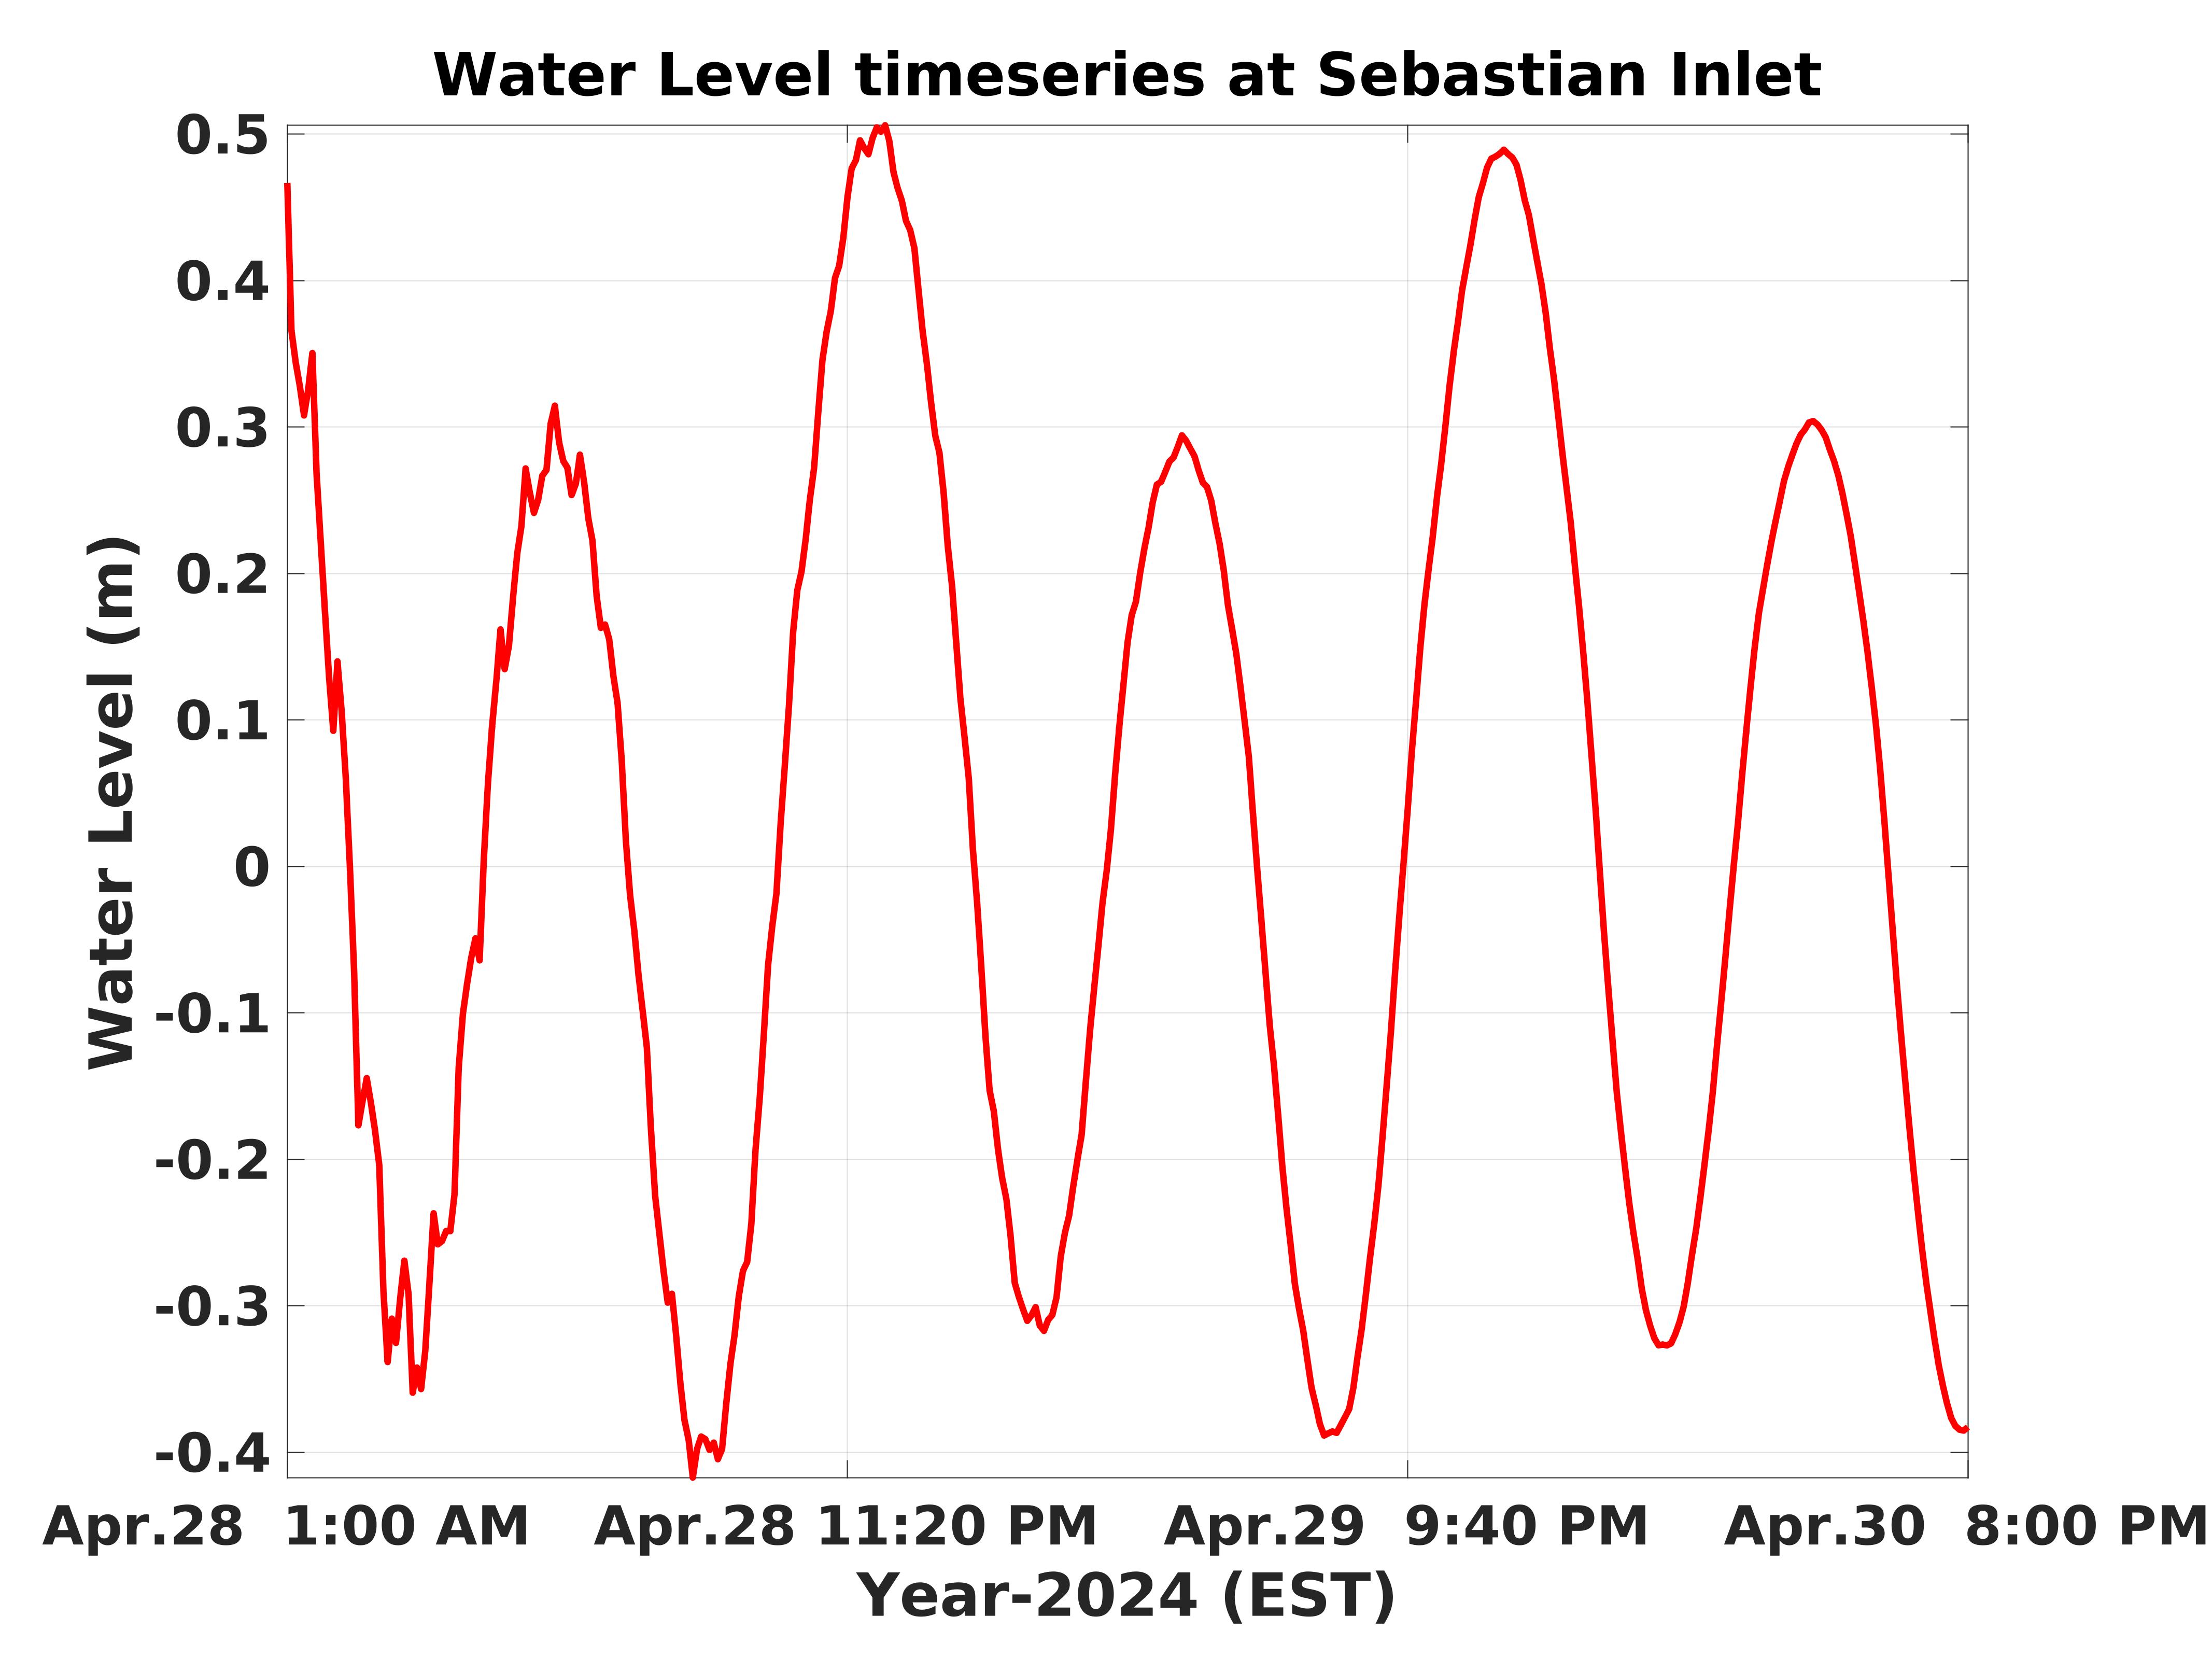
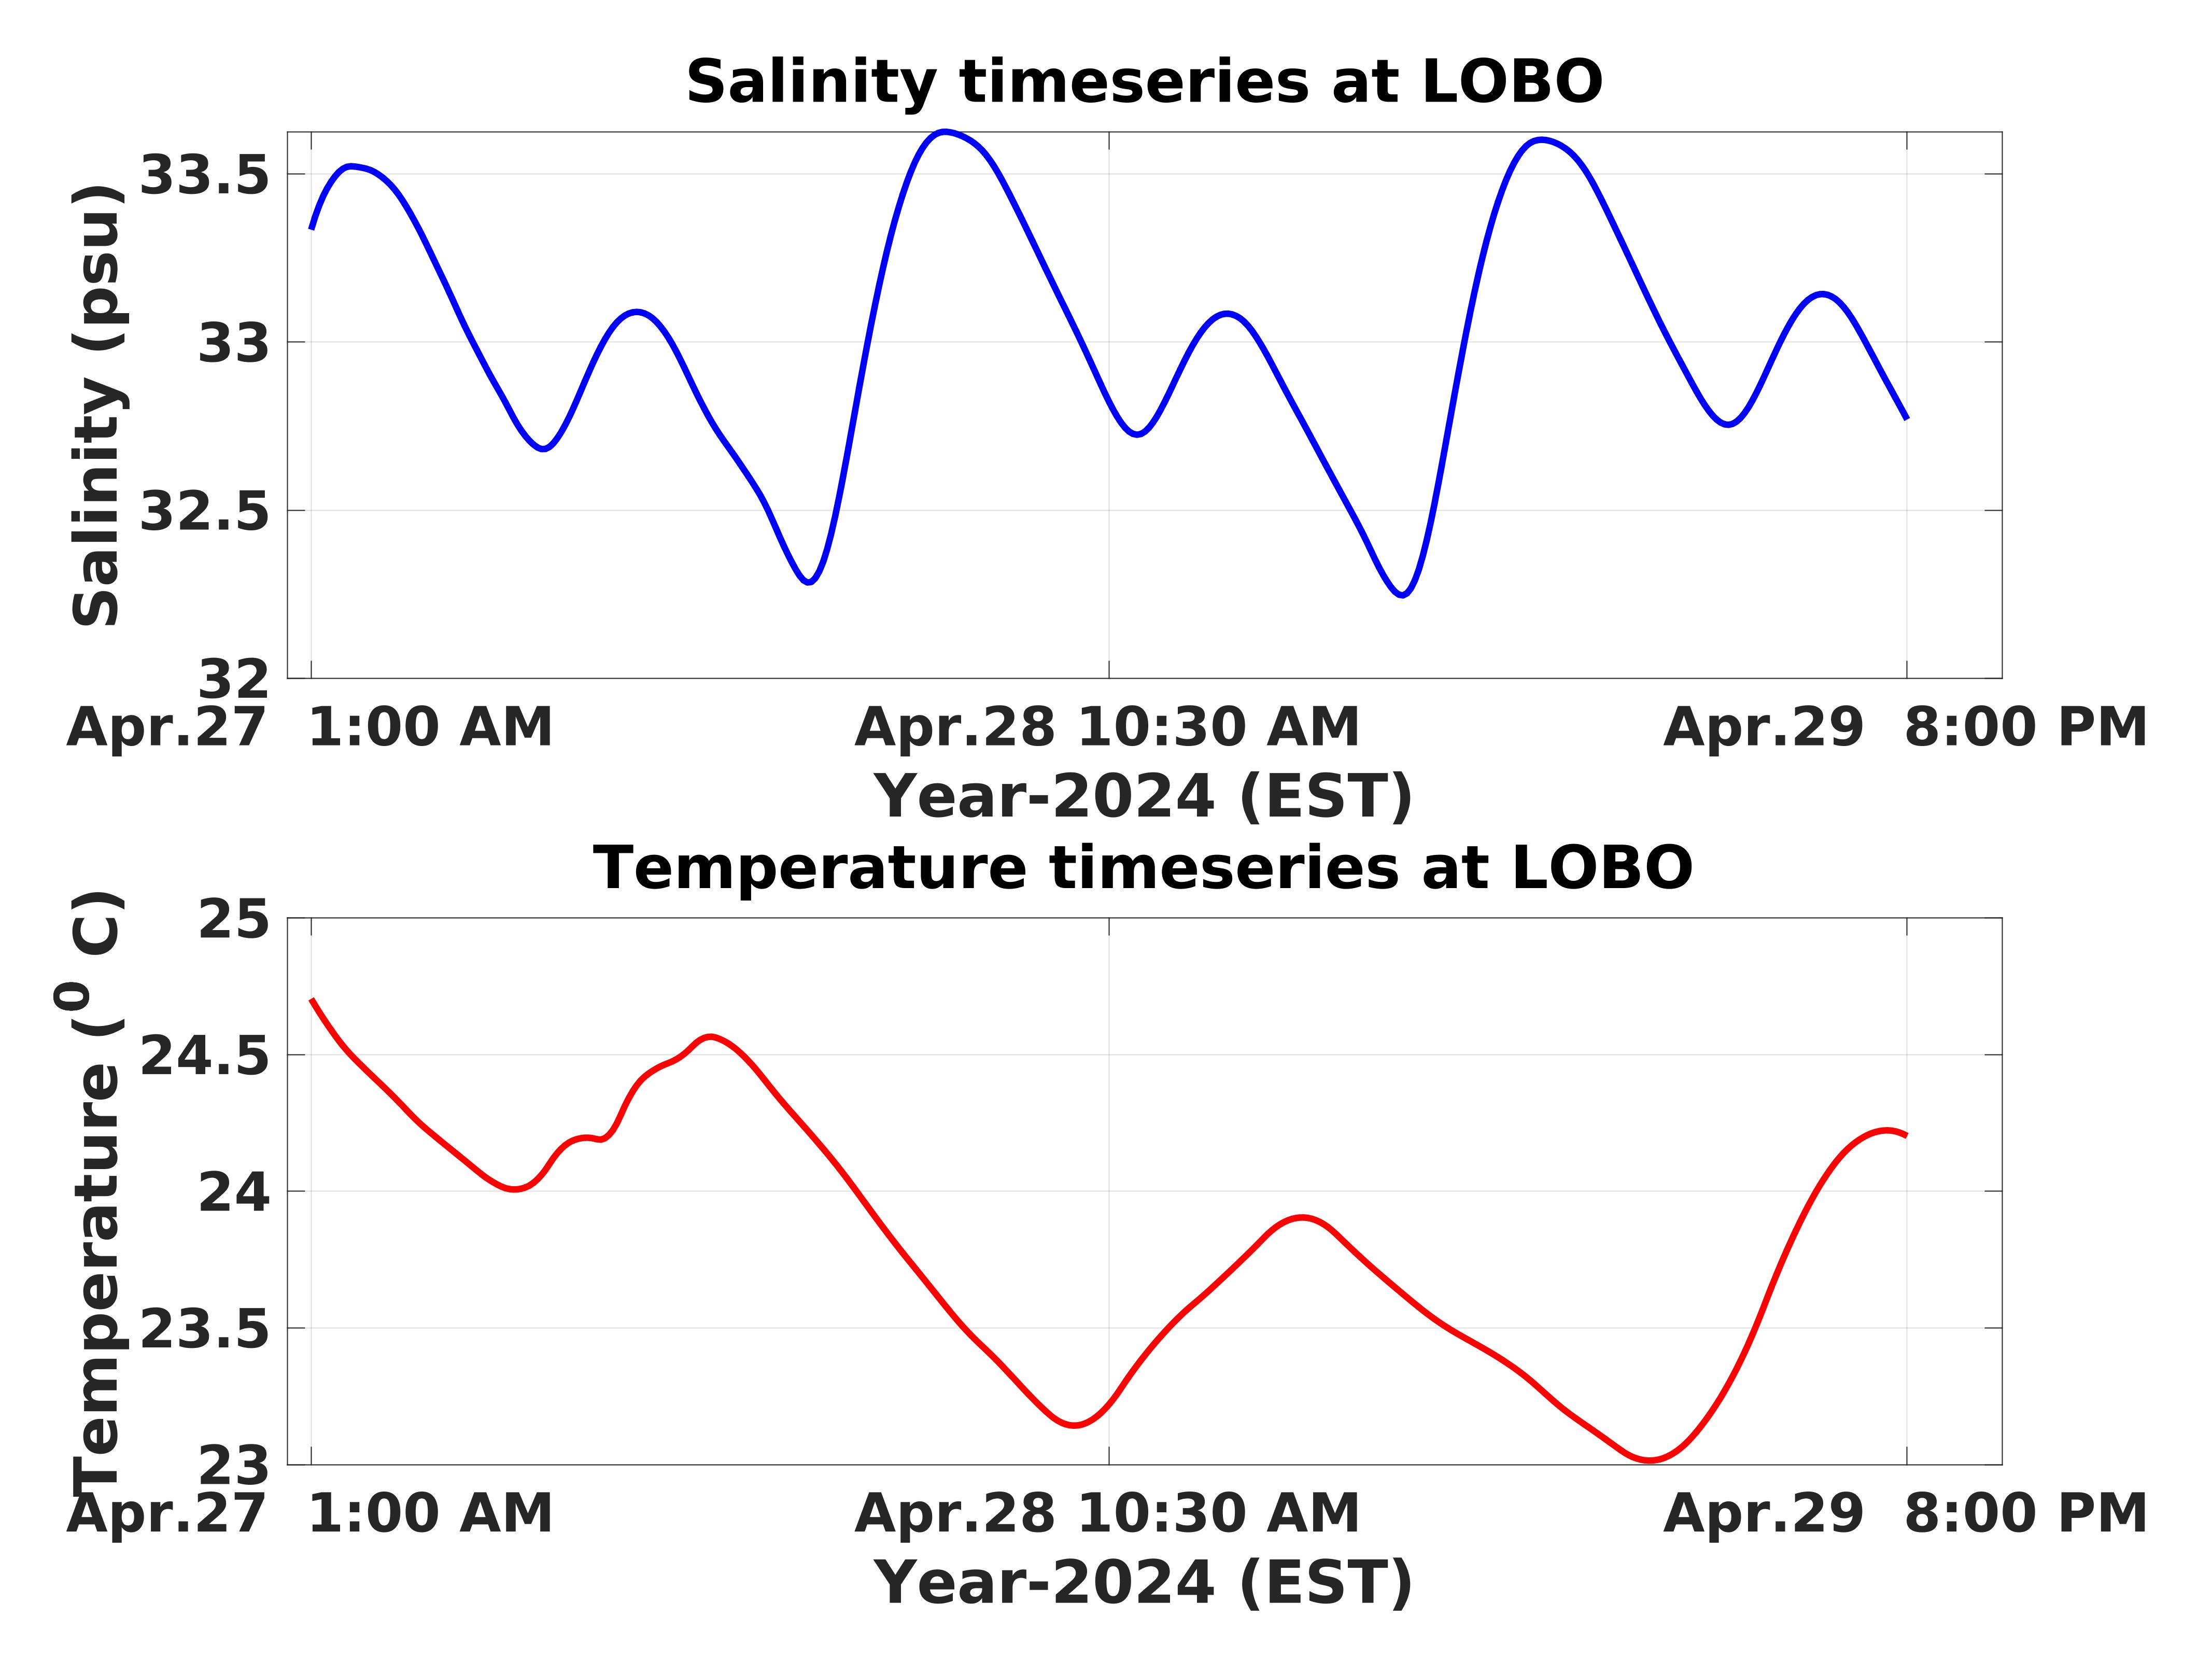
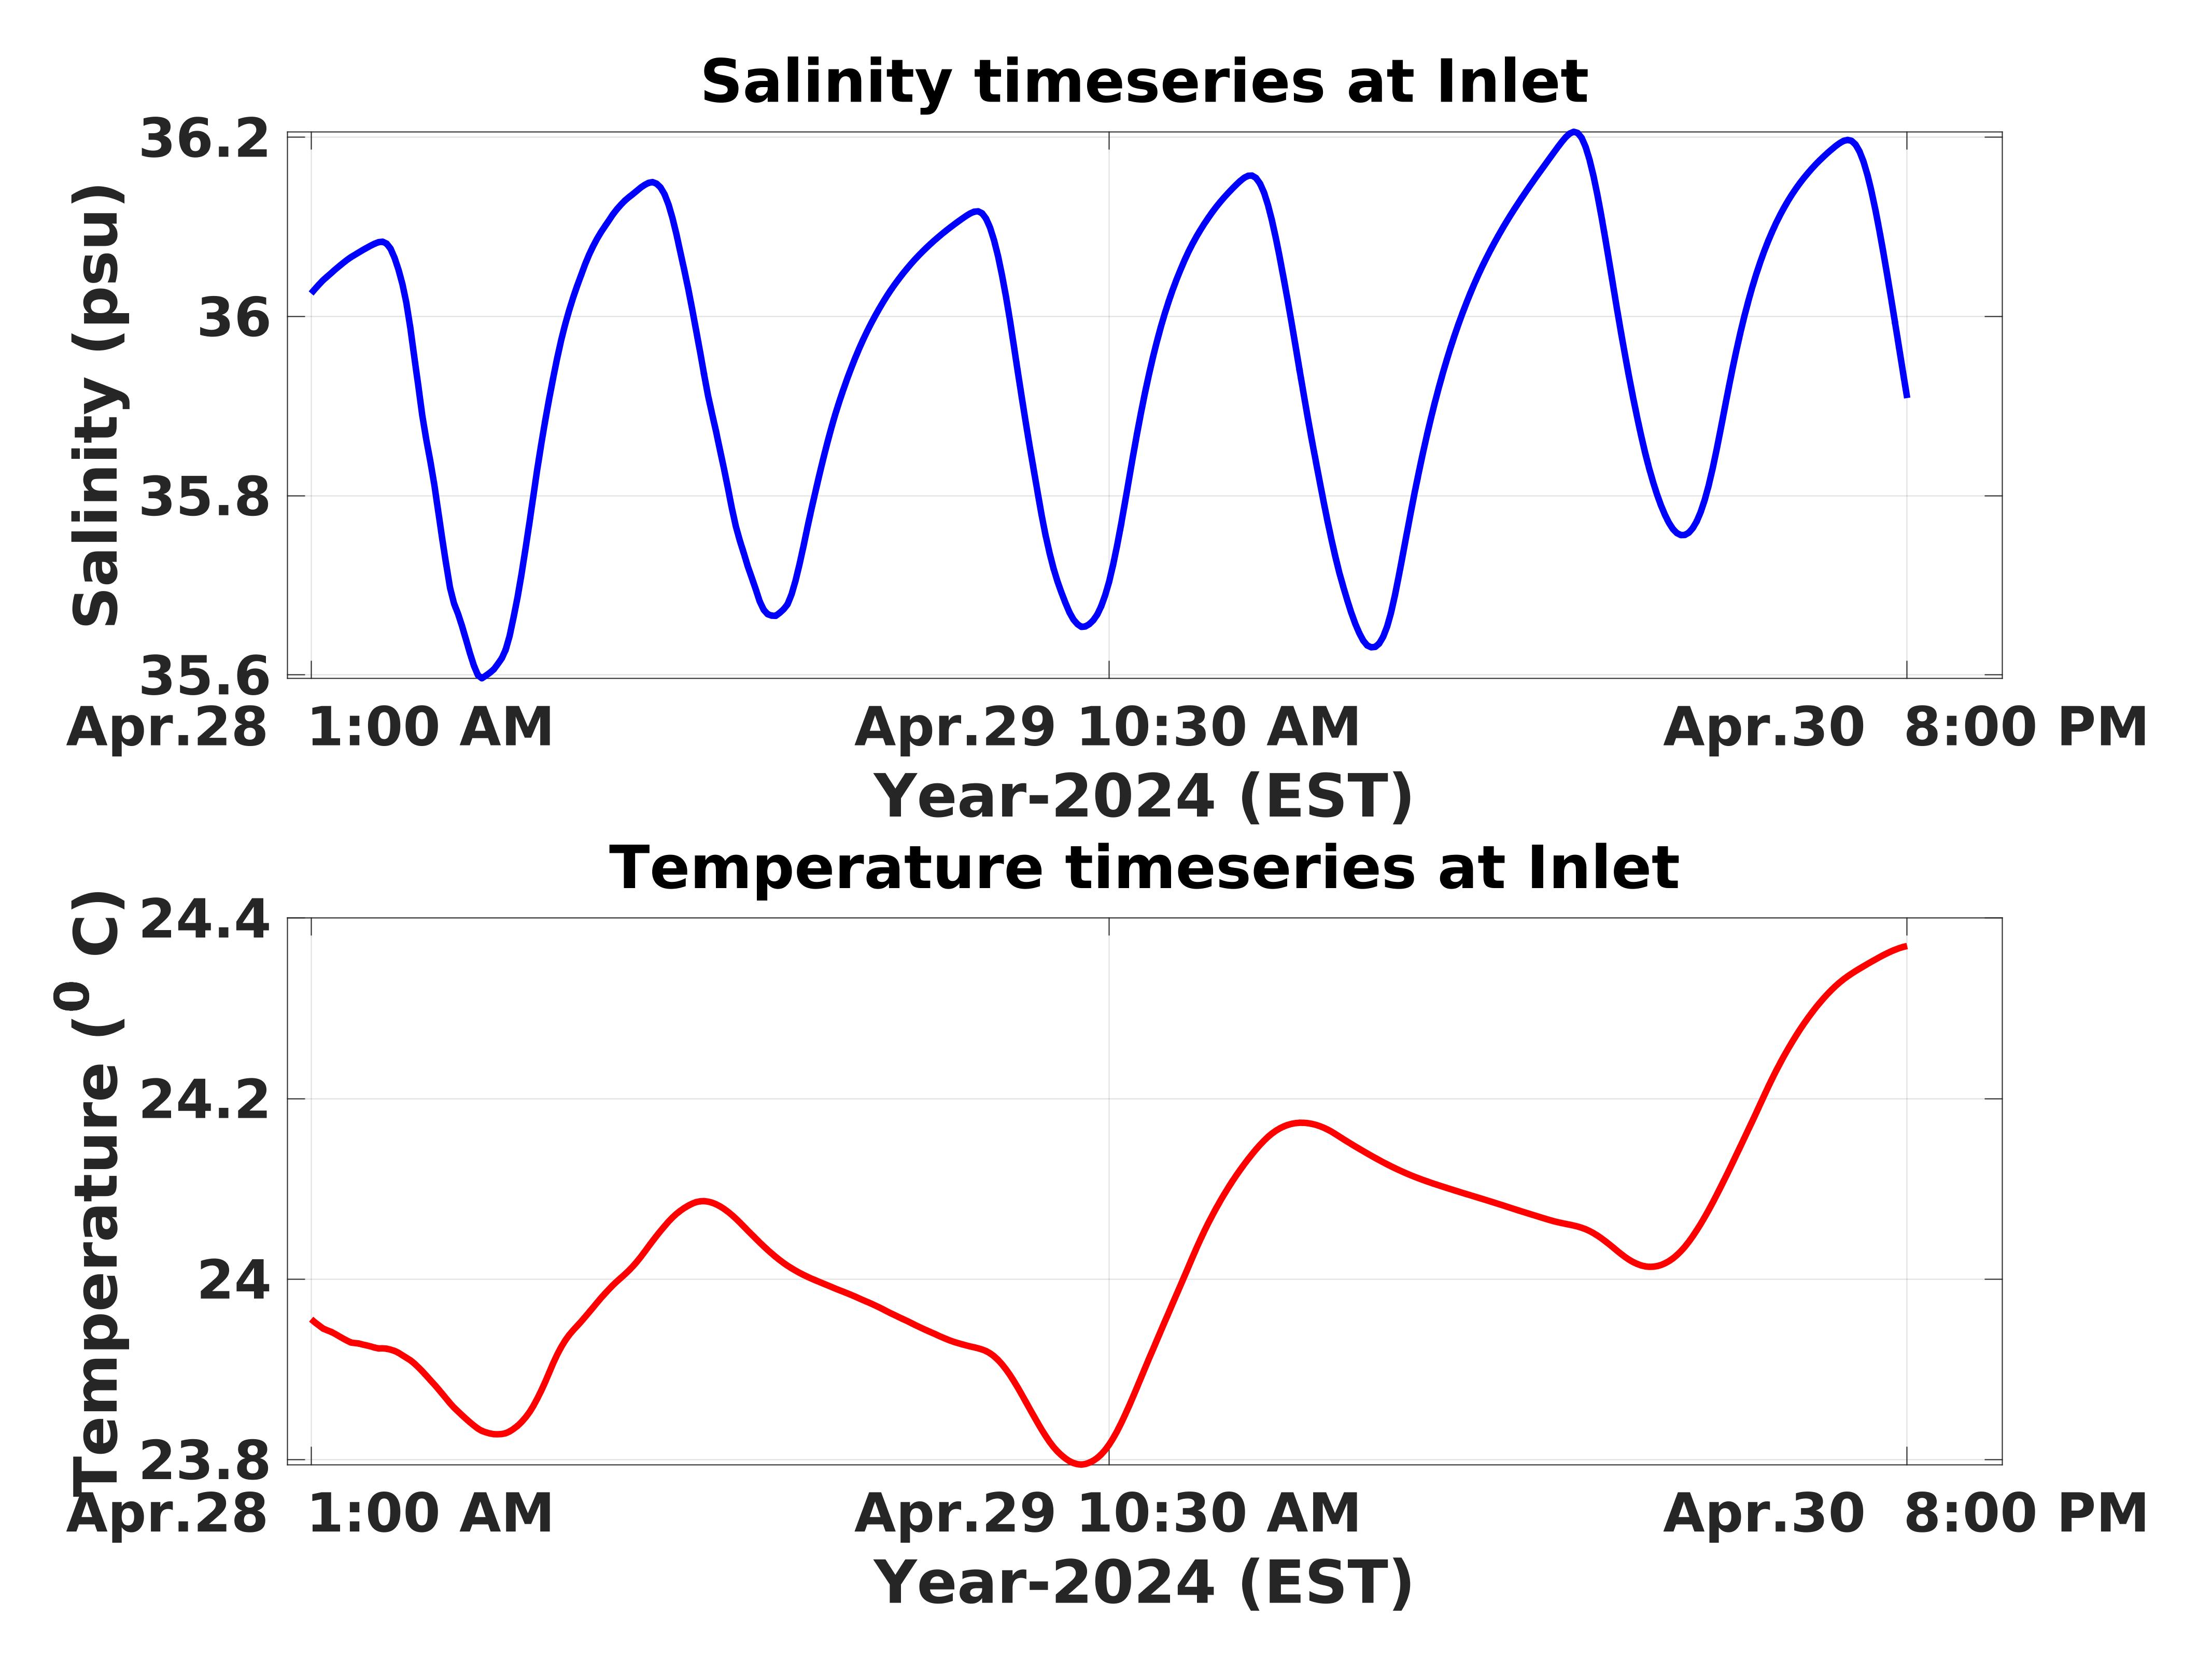
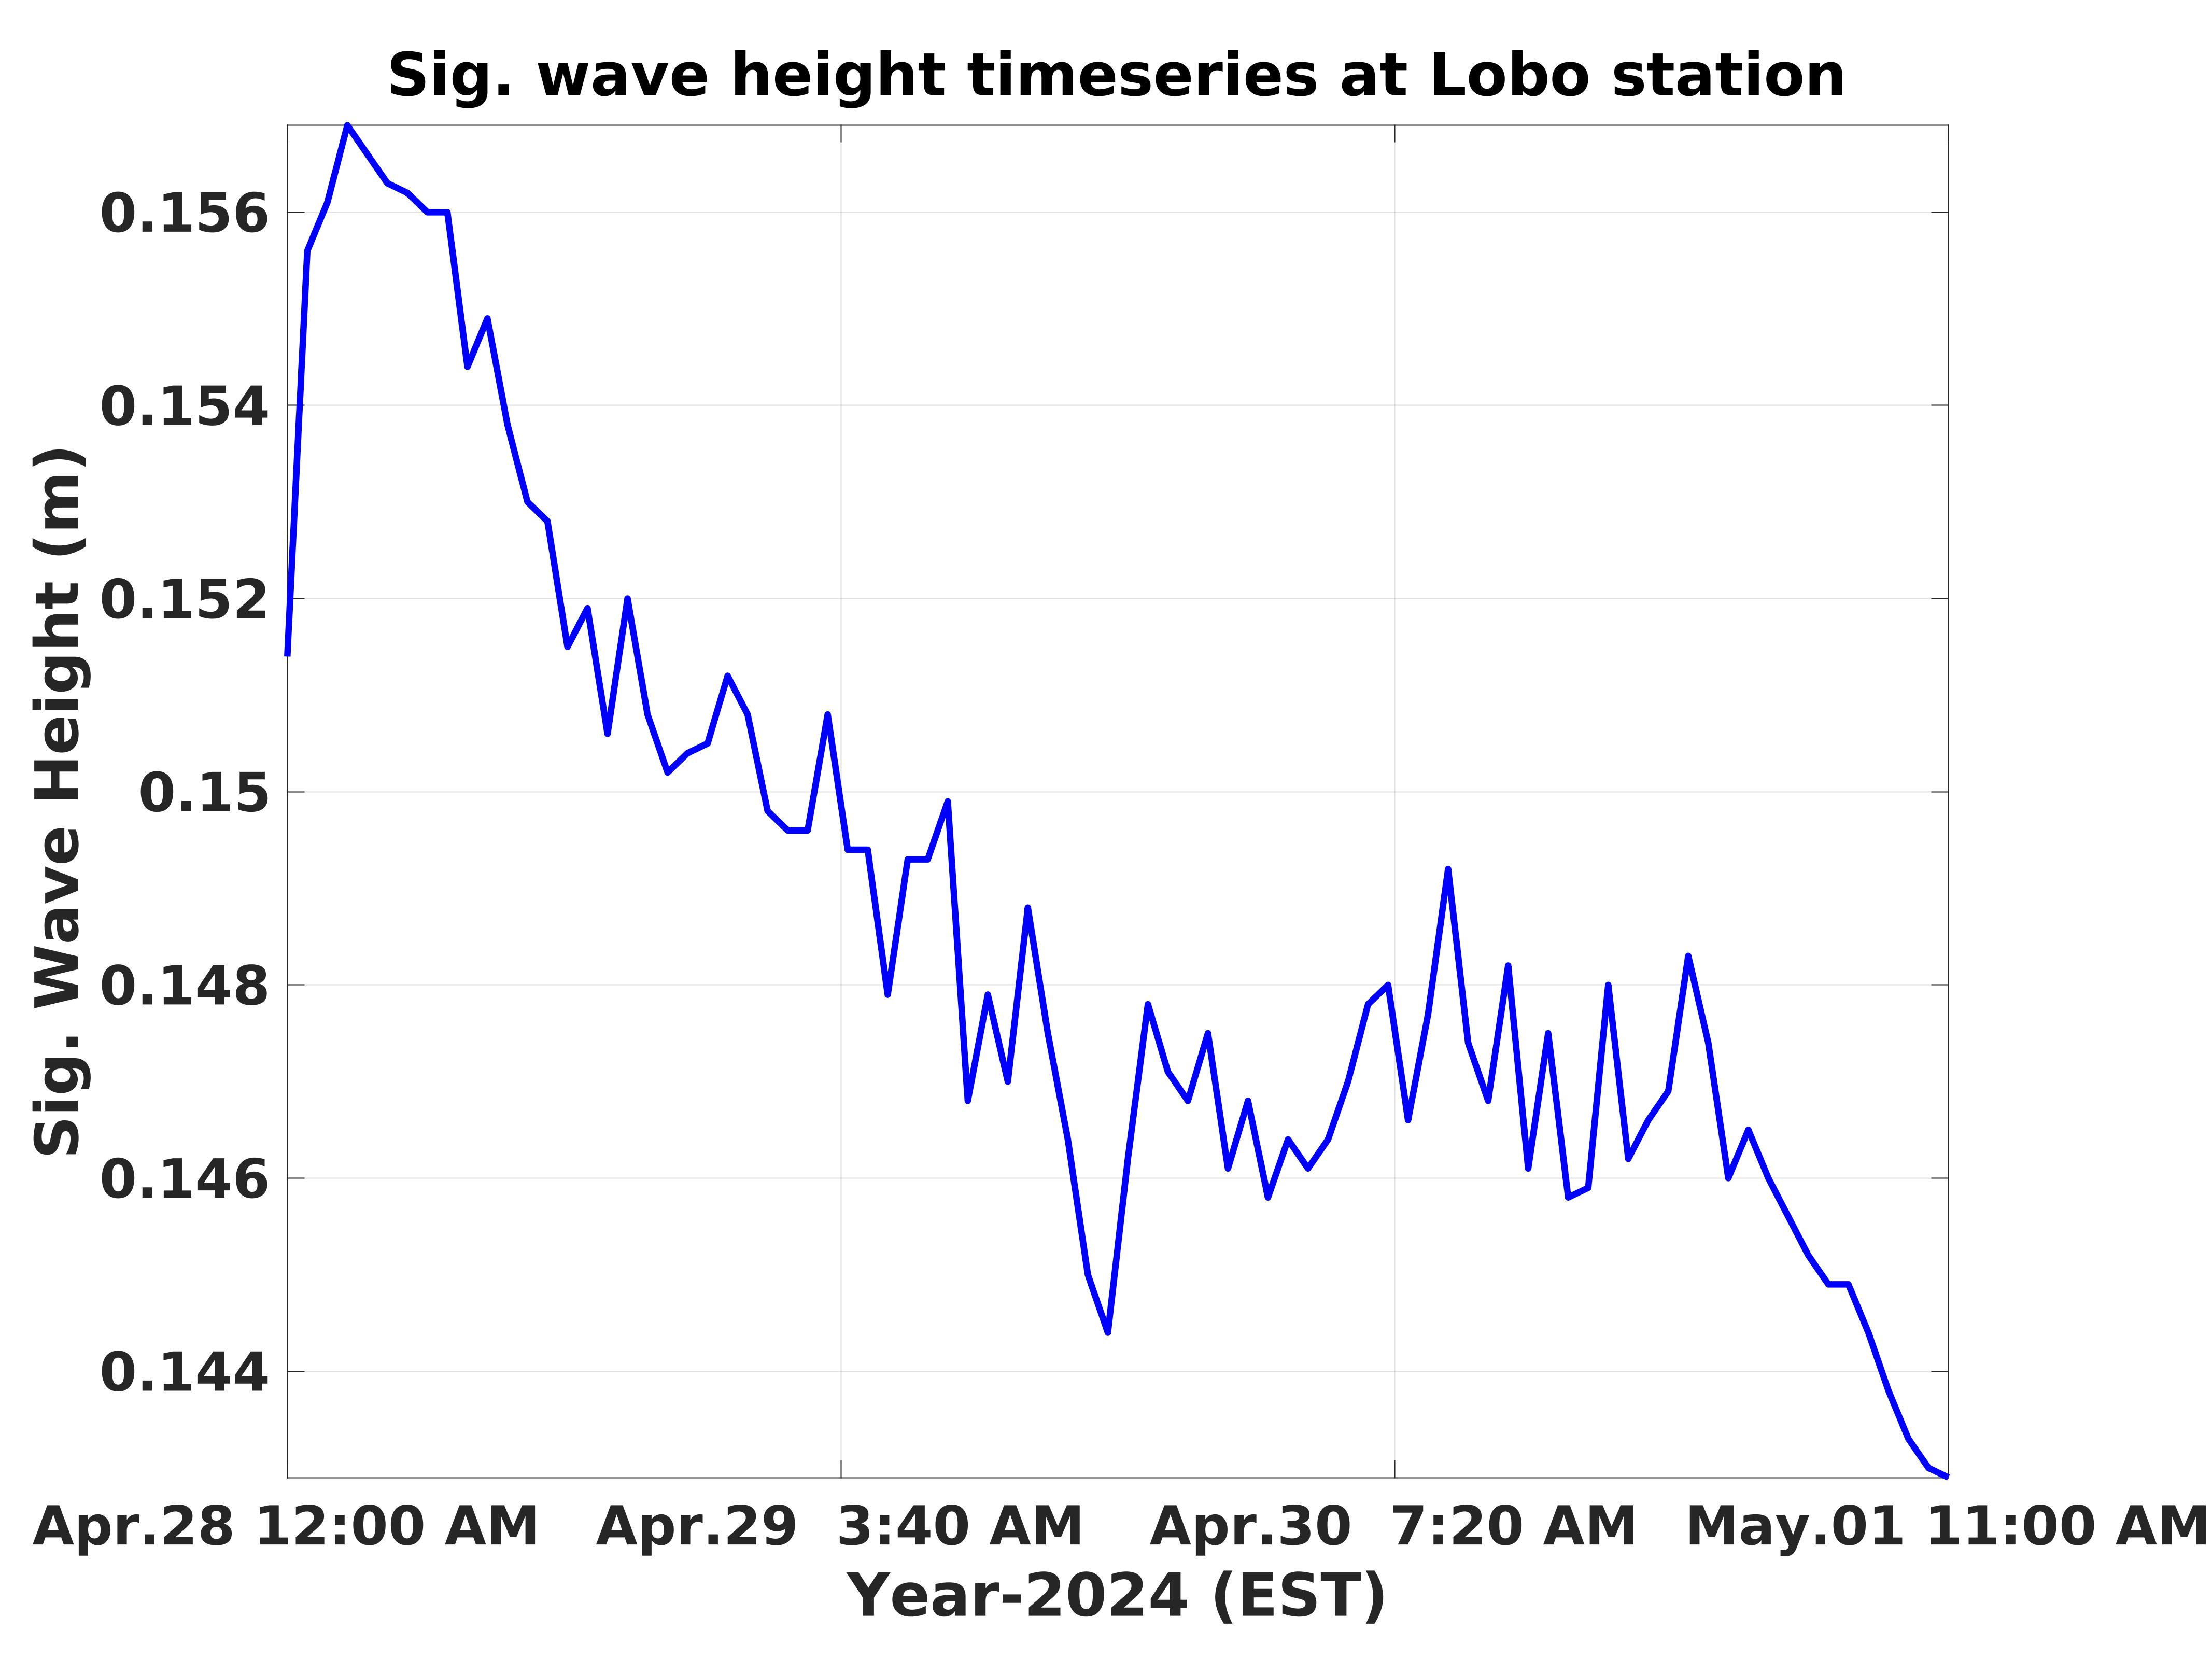
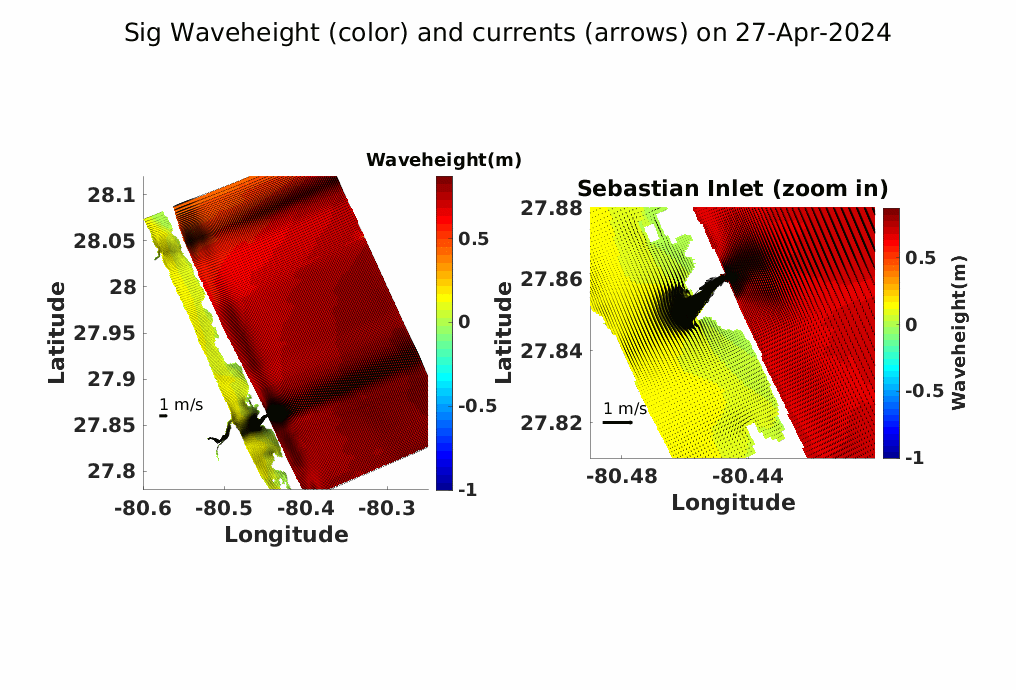
Model results for water level timeseries were compared with data from buoy near Sebastian Inlet. There is a good match between model results and buoy data for water level timeseries with small difference in amplitude but very good match between phases. Correlation comparison is well over 90%. Salinity. temperature, and sig. wave height from simulation results were also compared with measured data. These comparisons showed good match with observed data. Following figures show these comparisons.
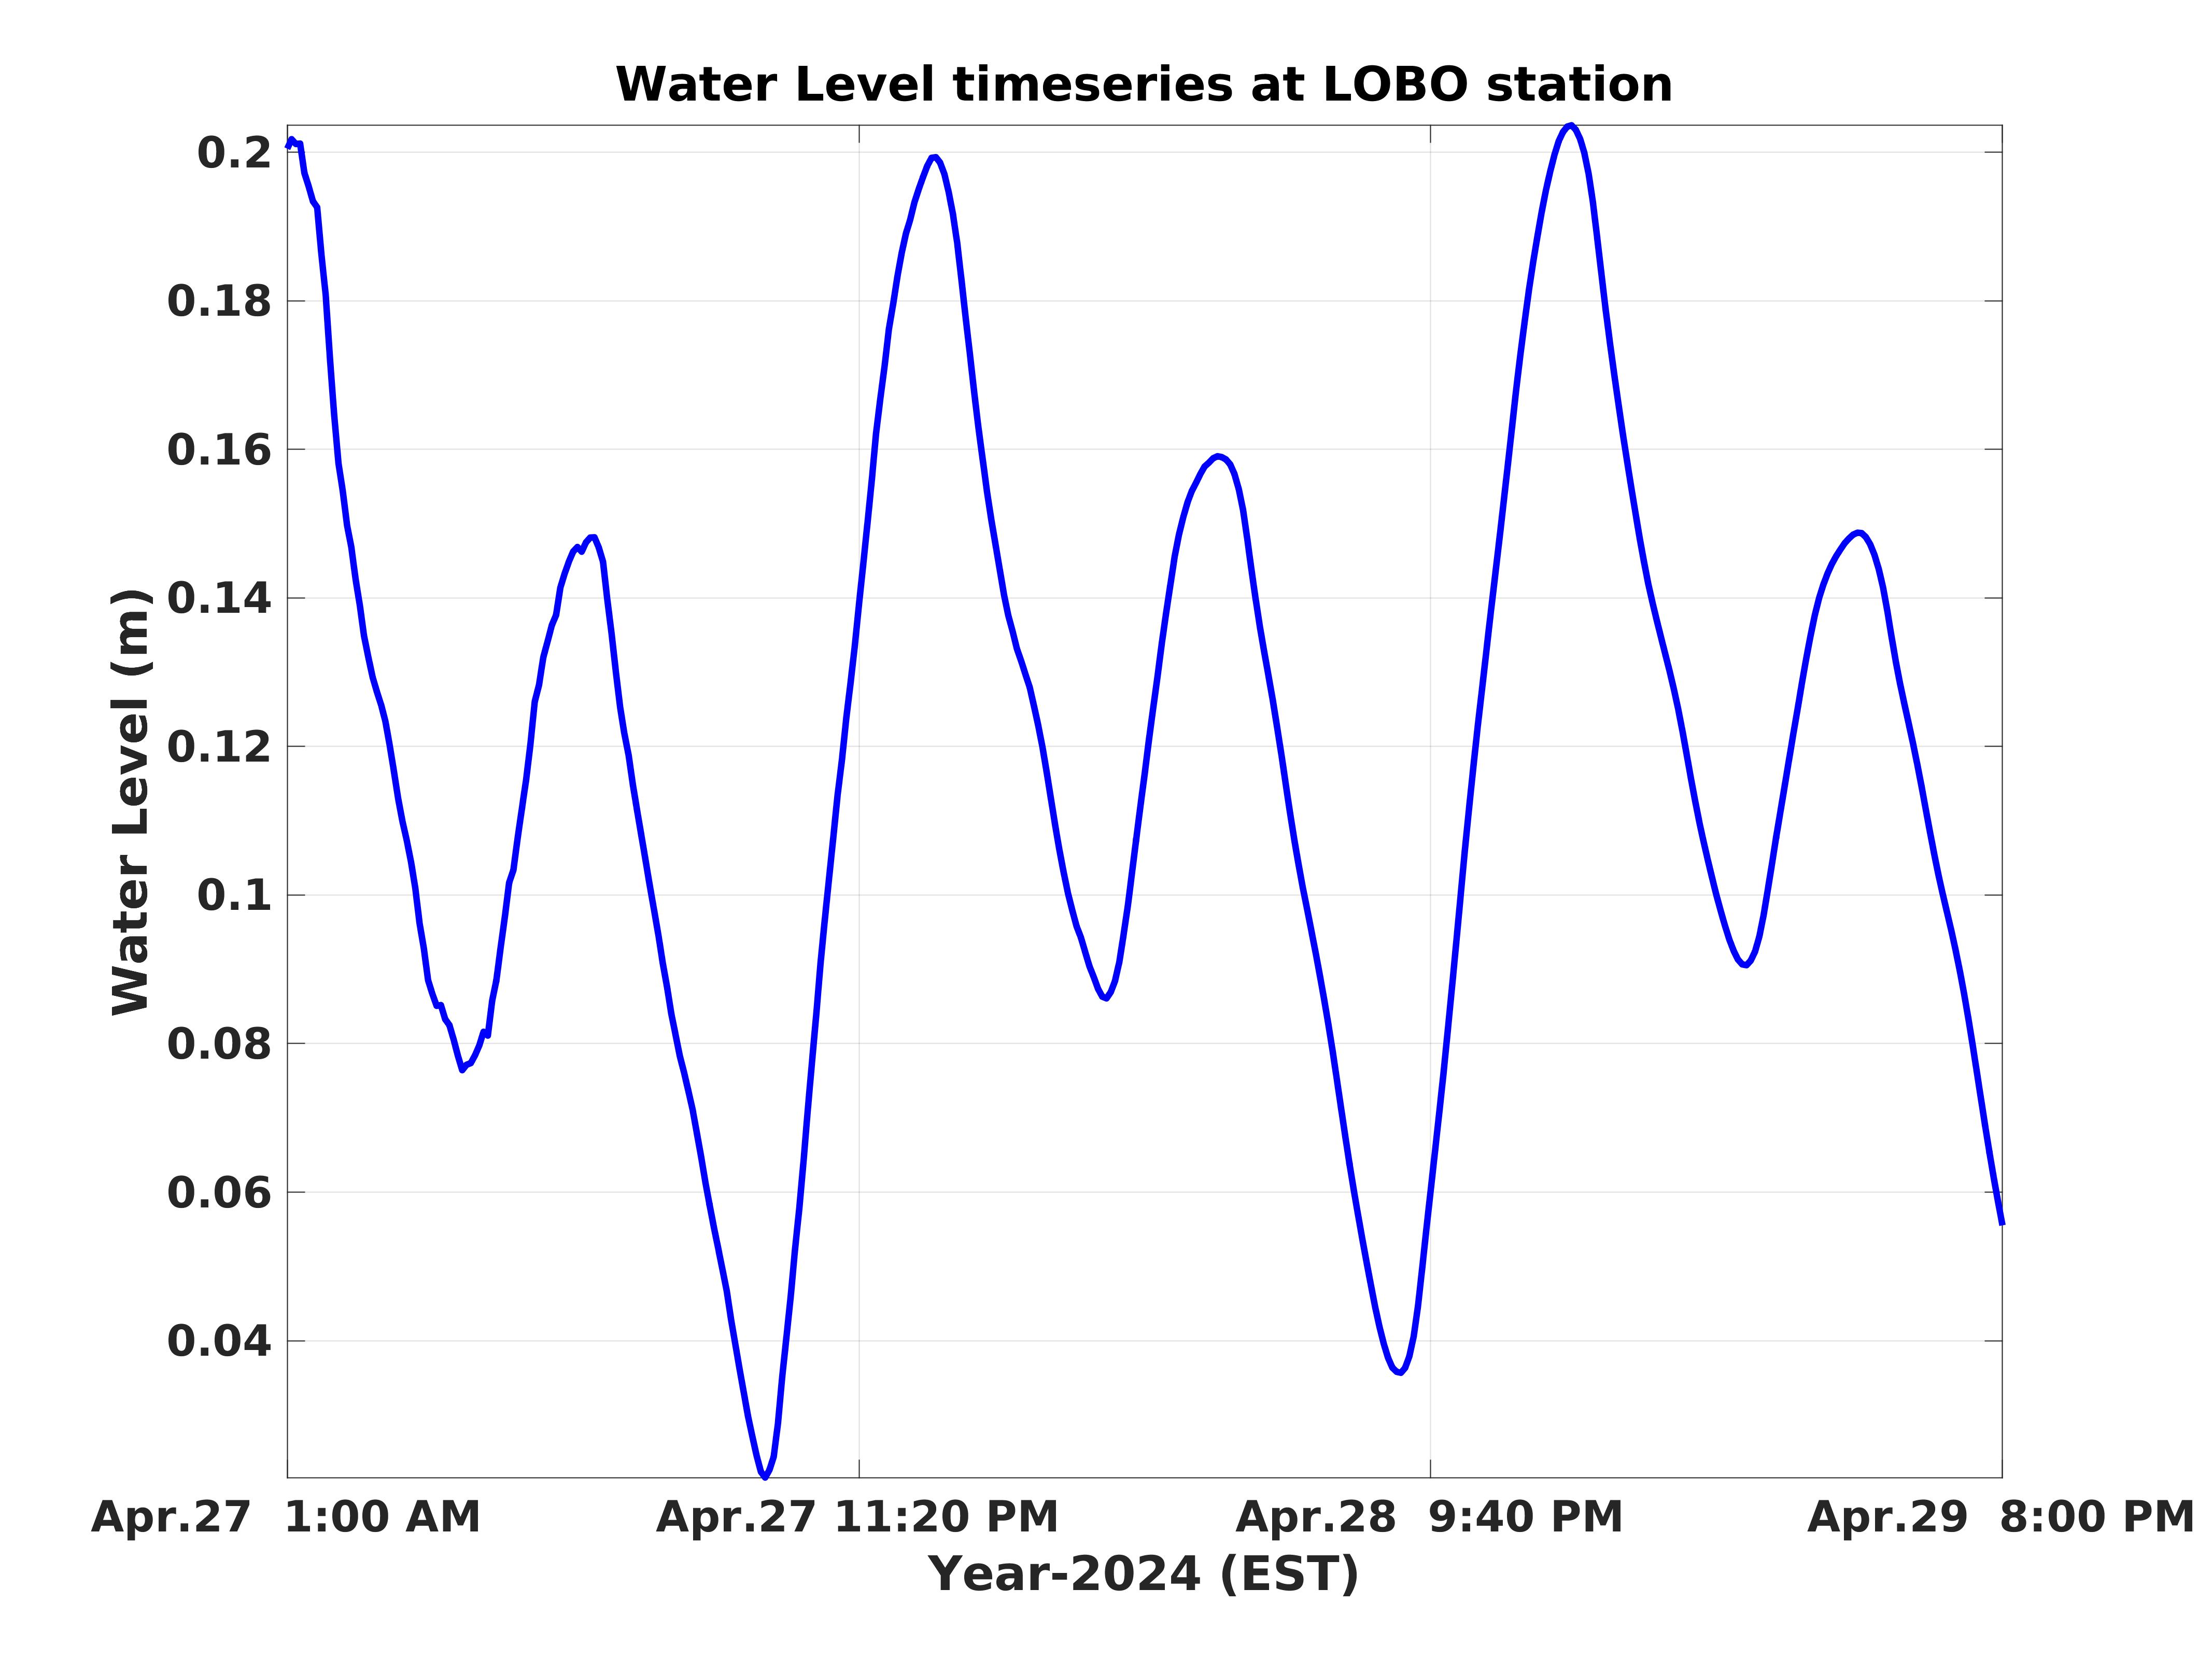
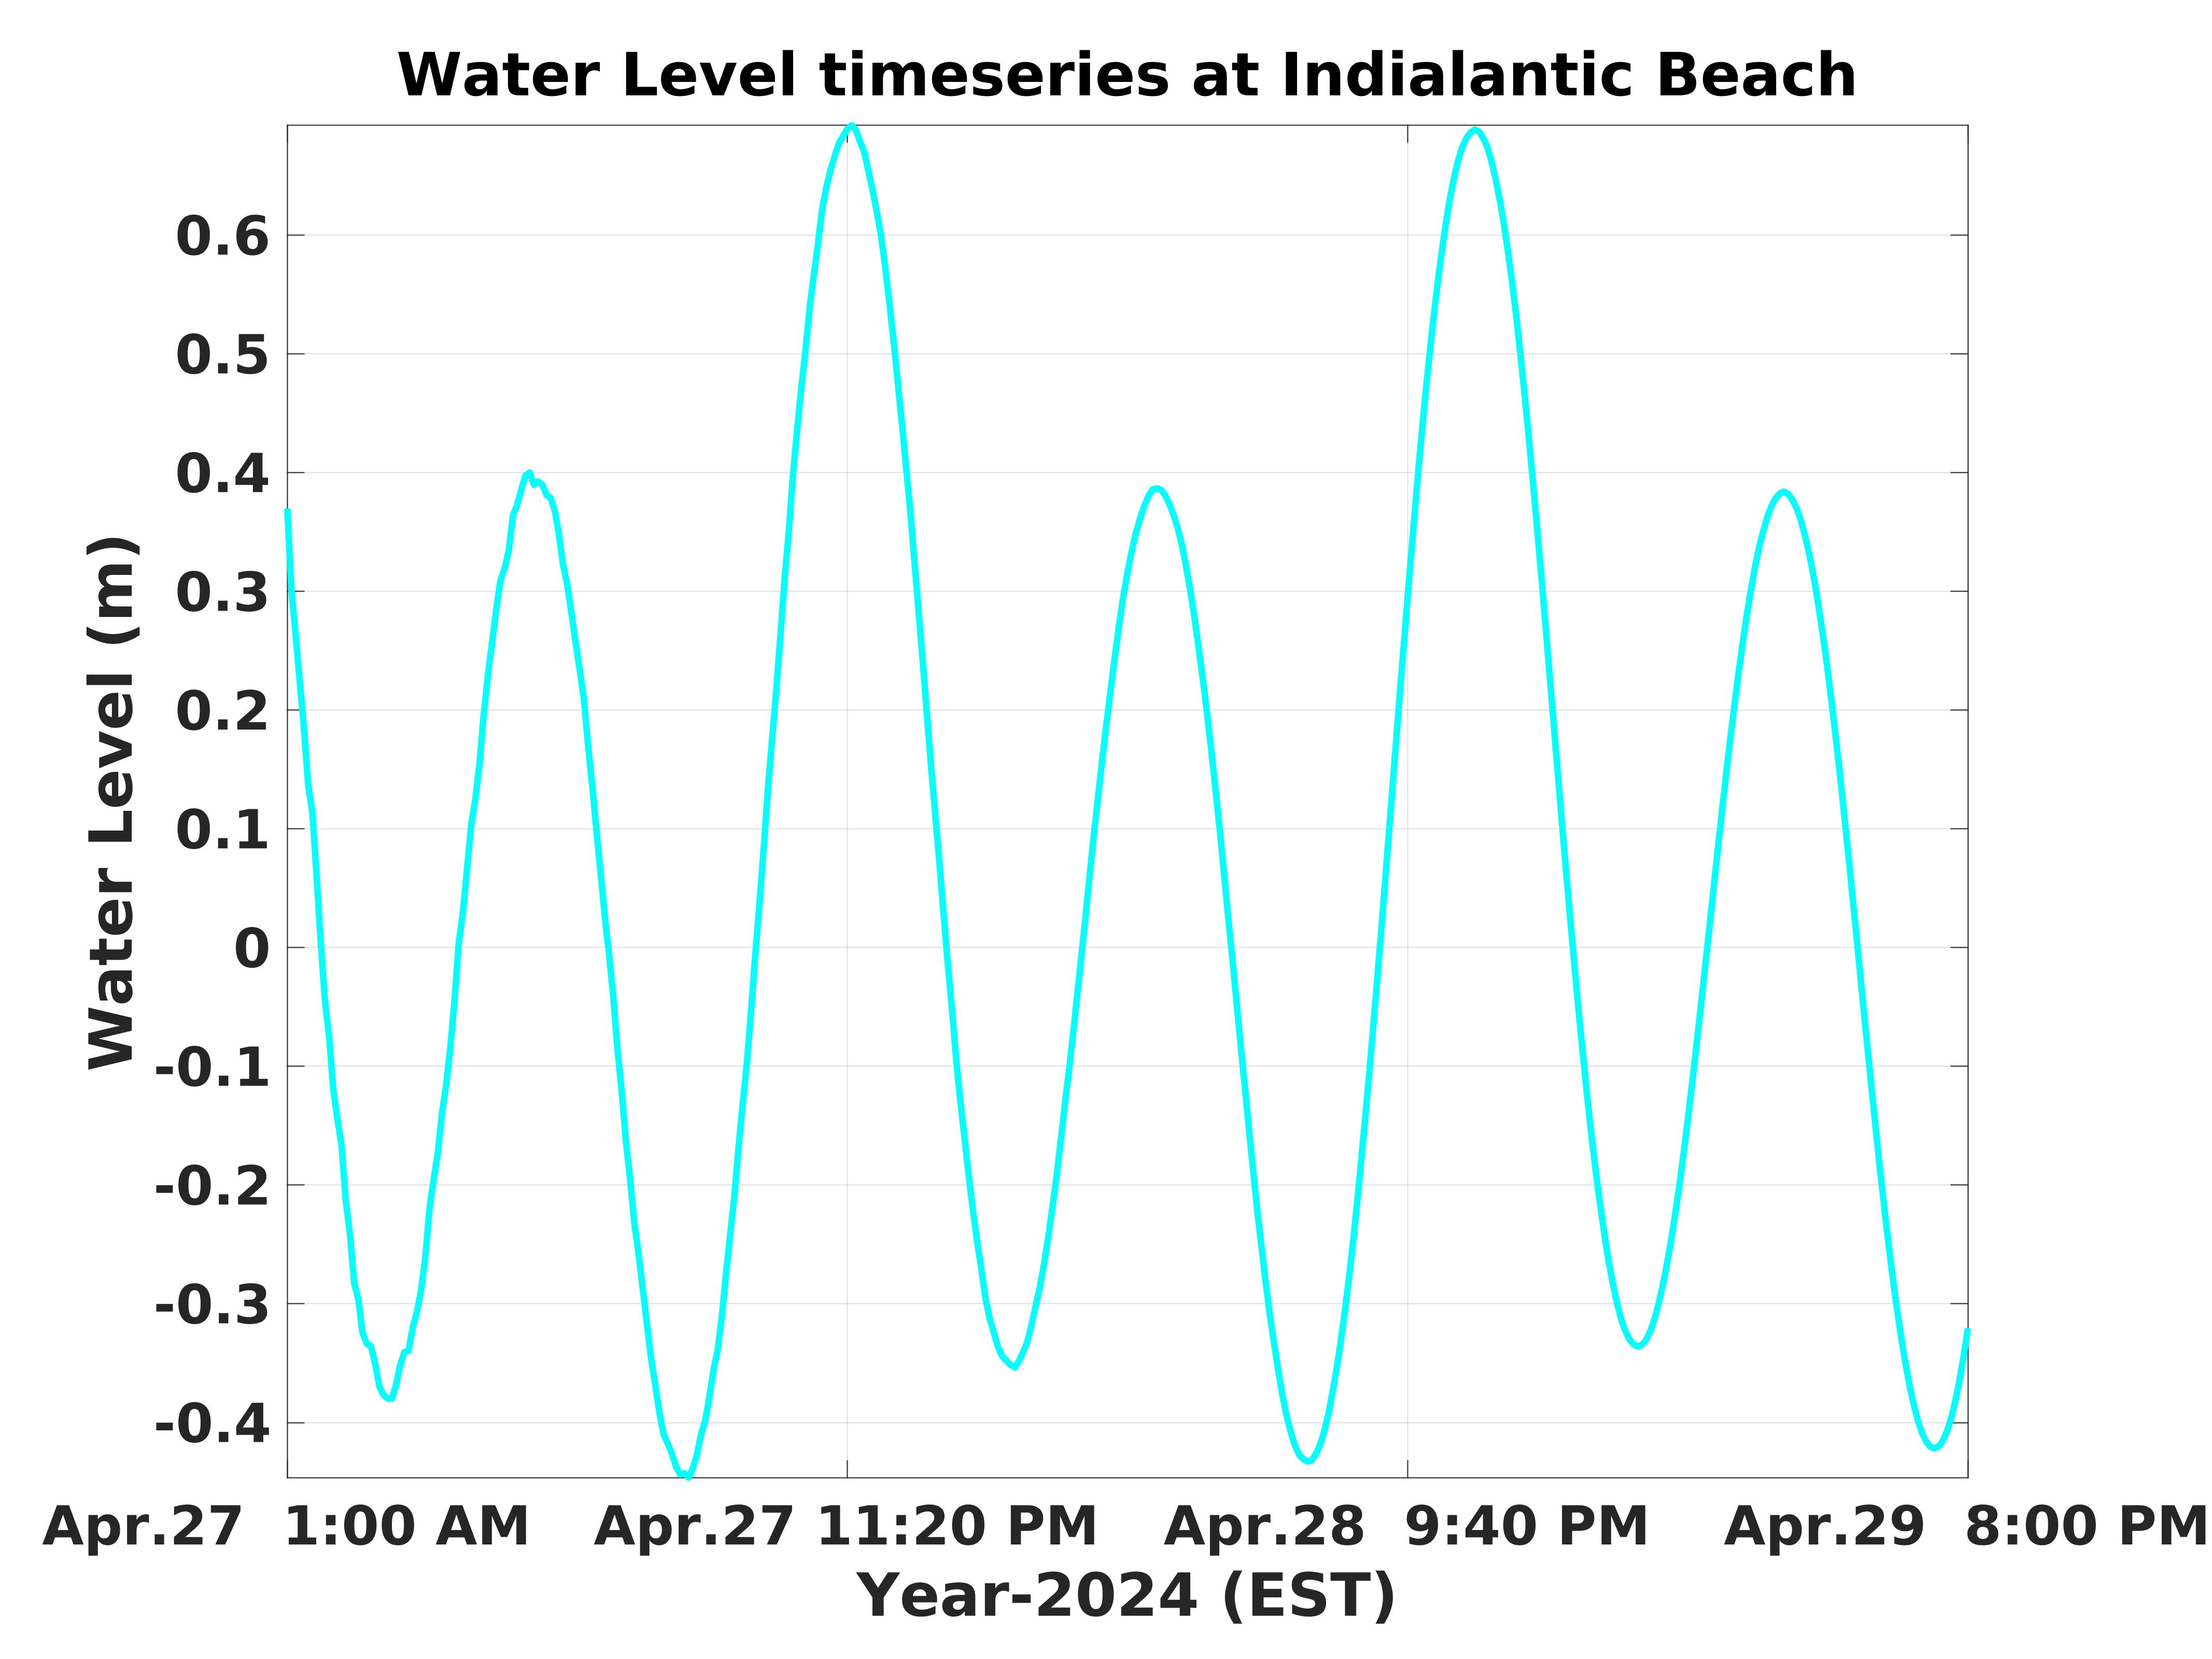
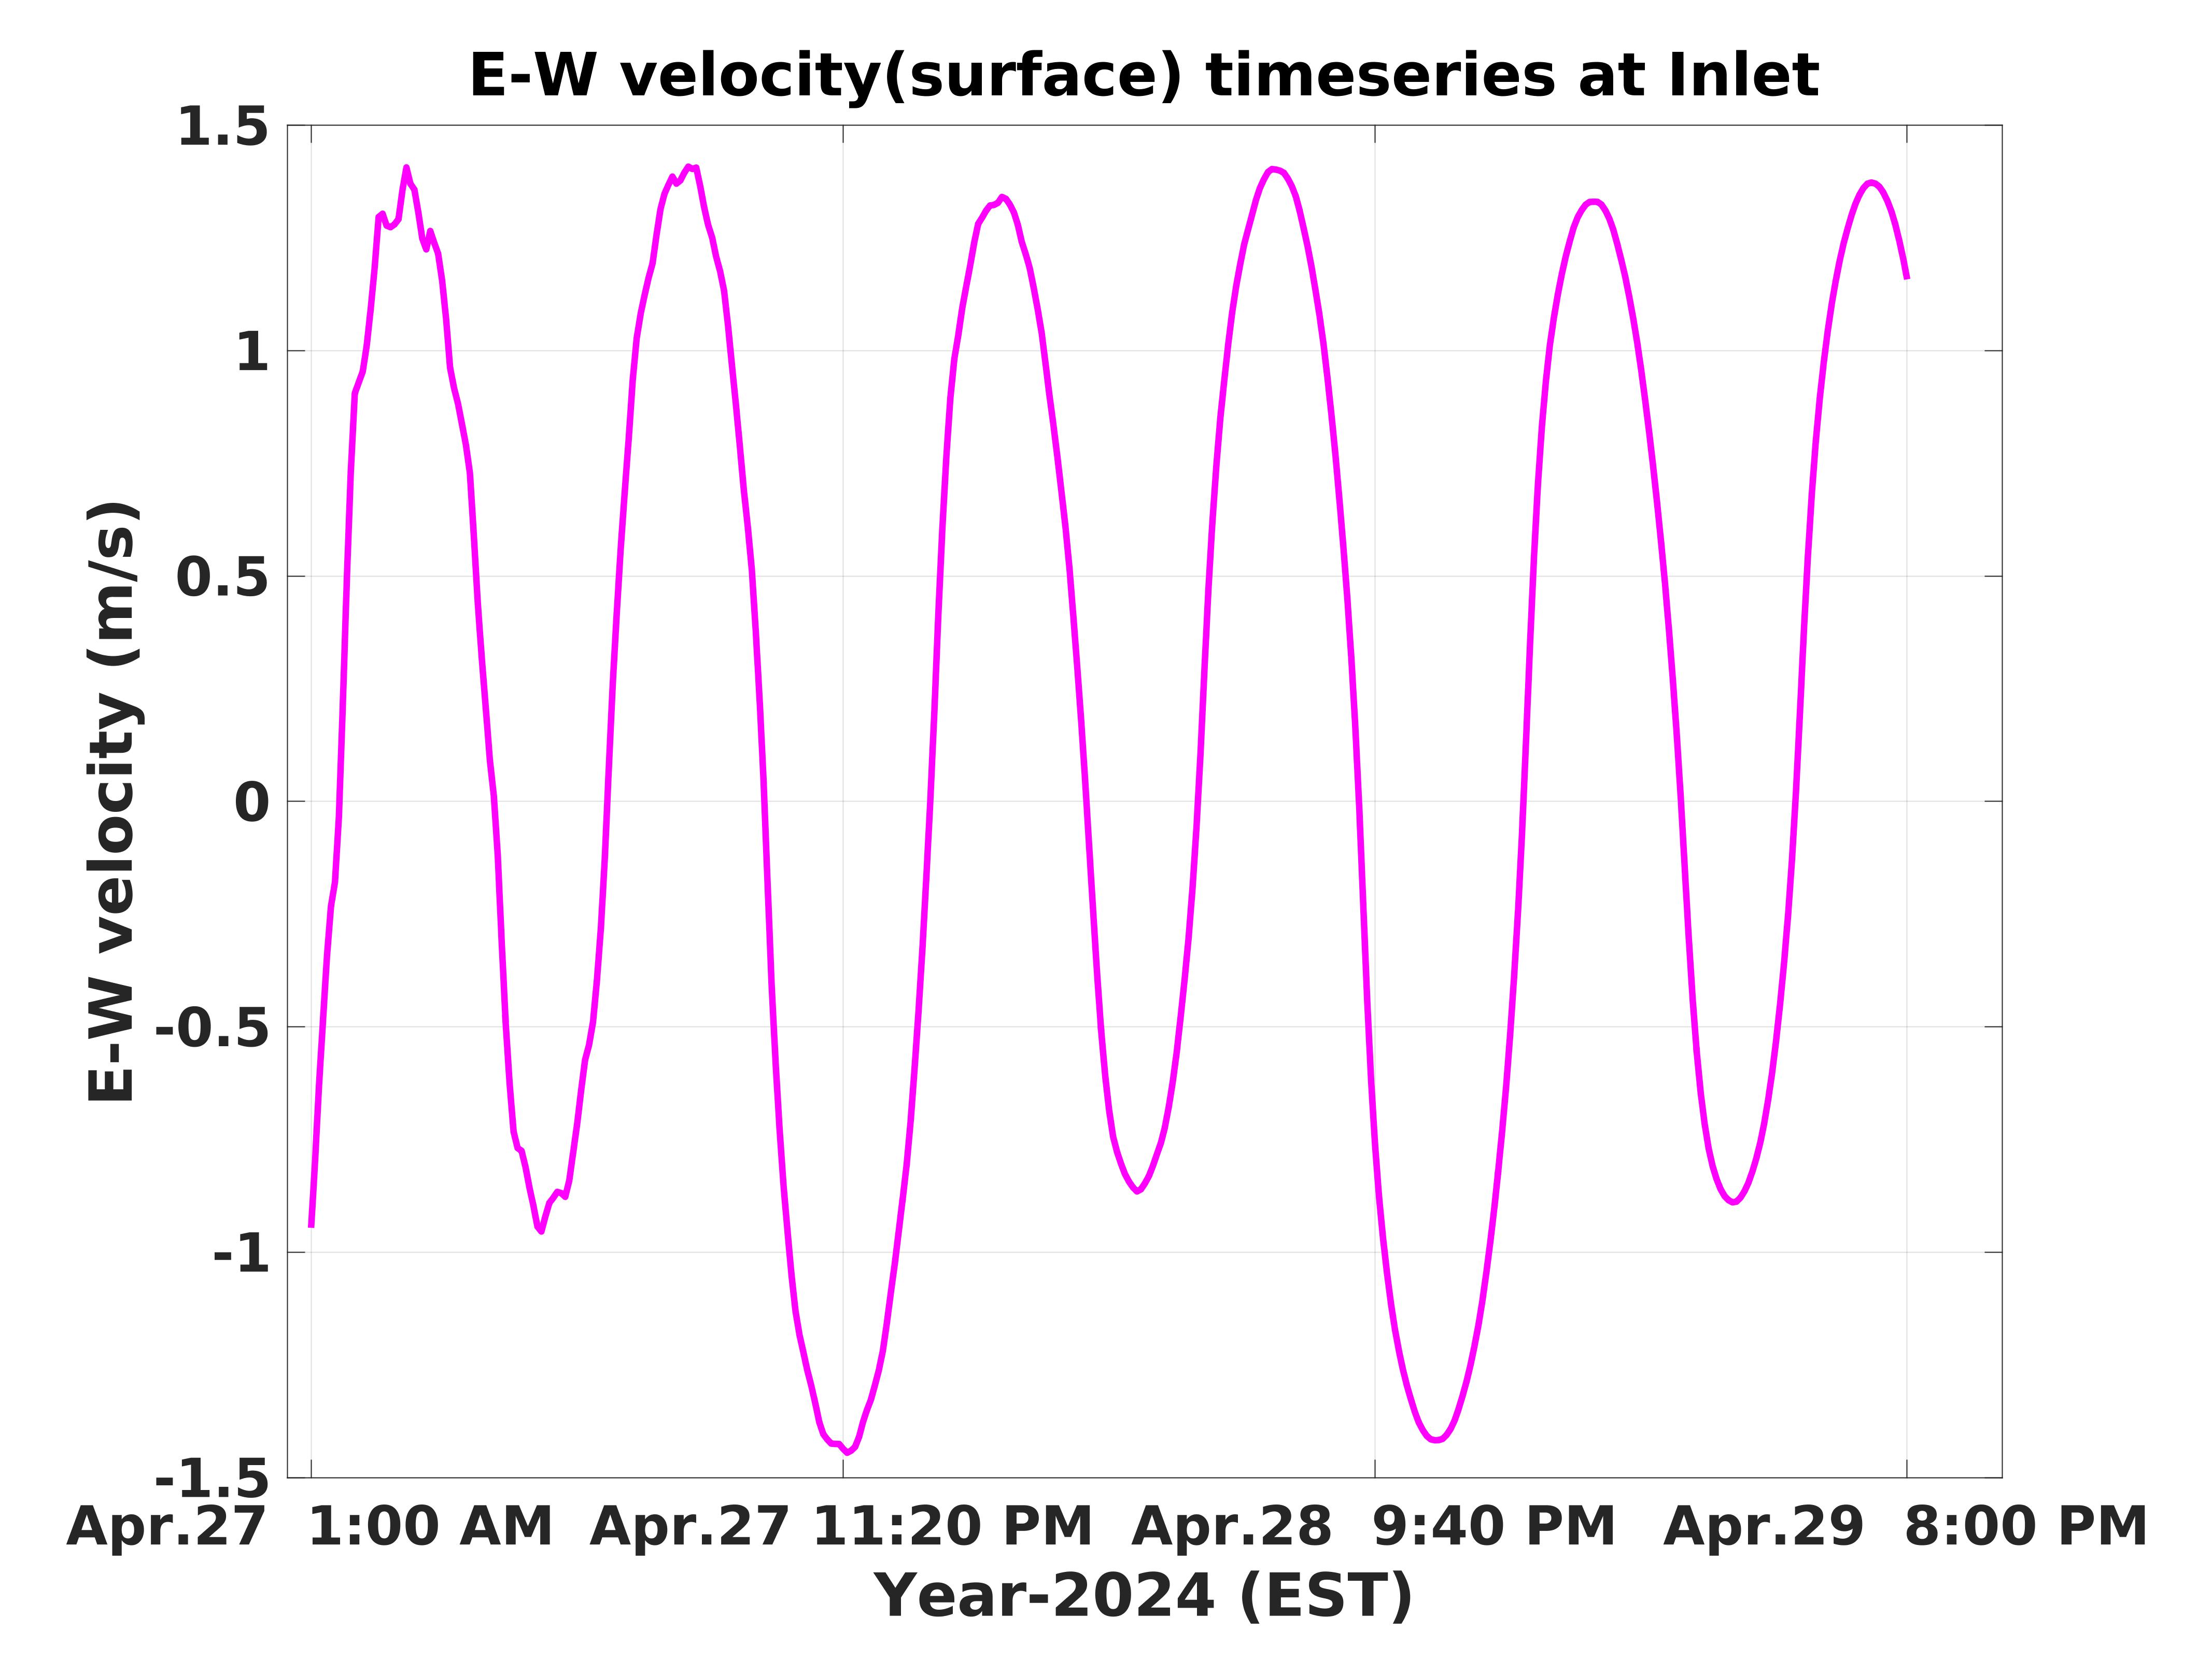
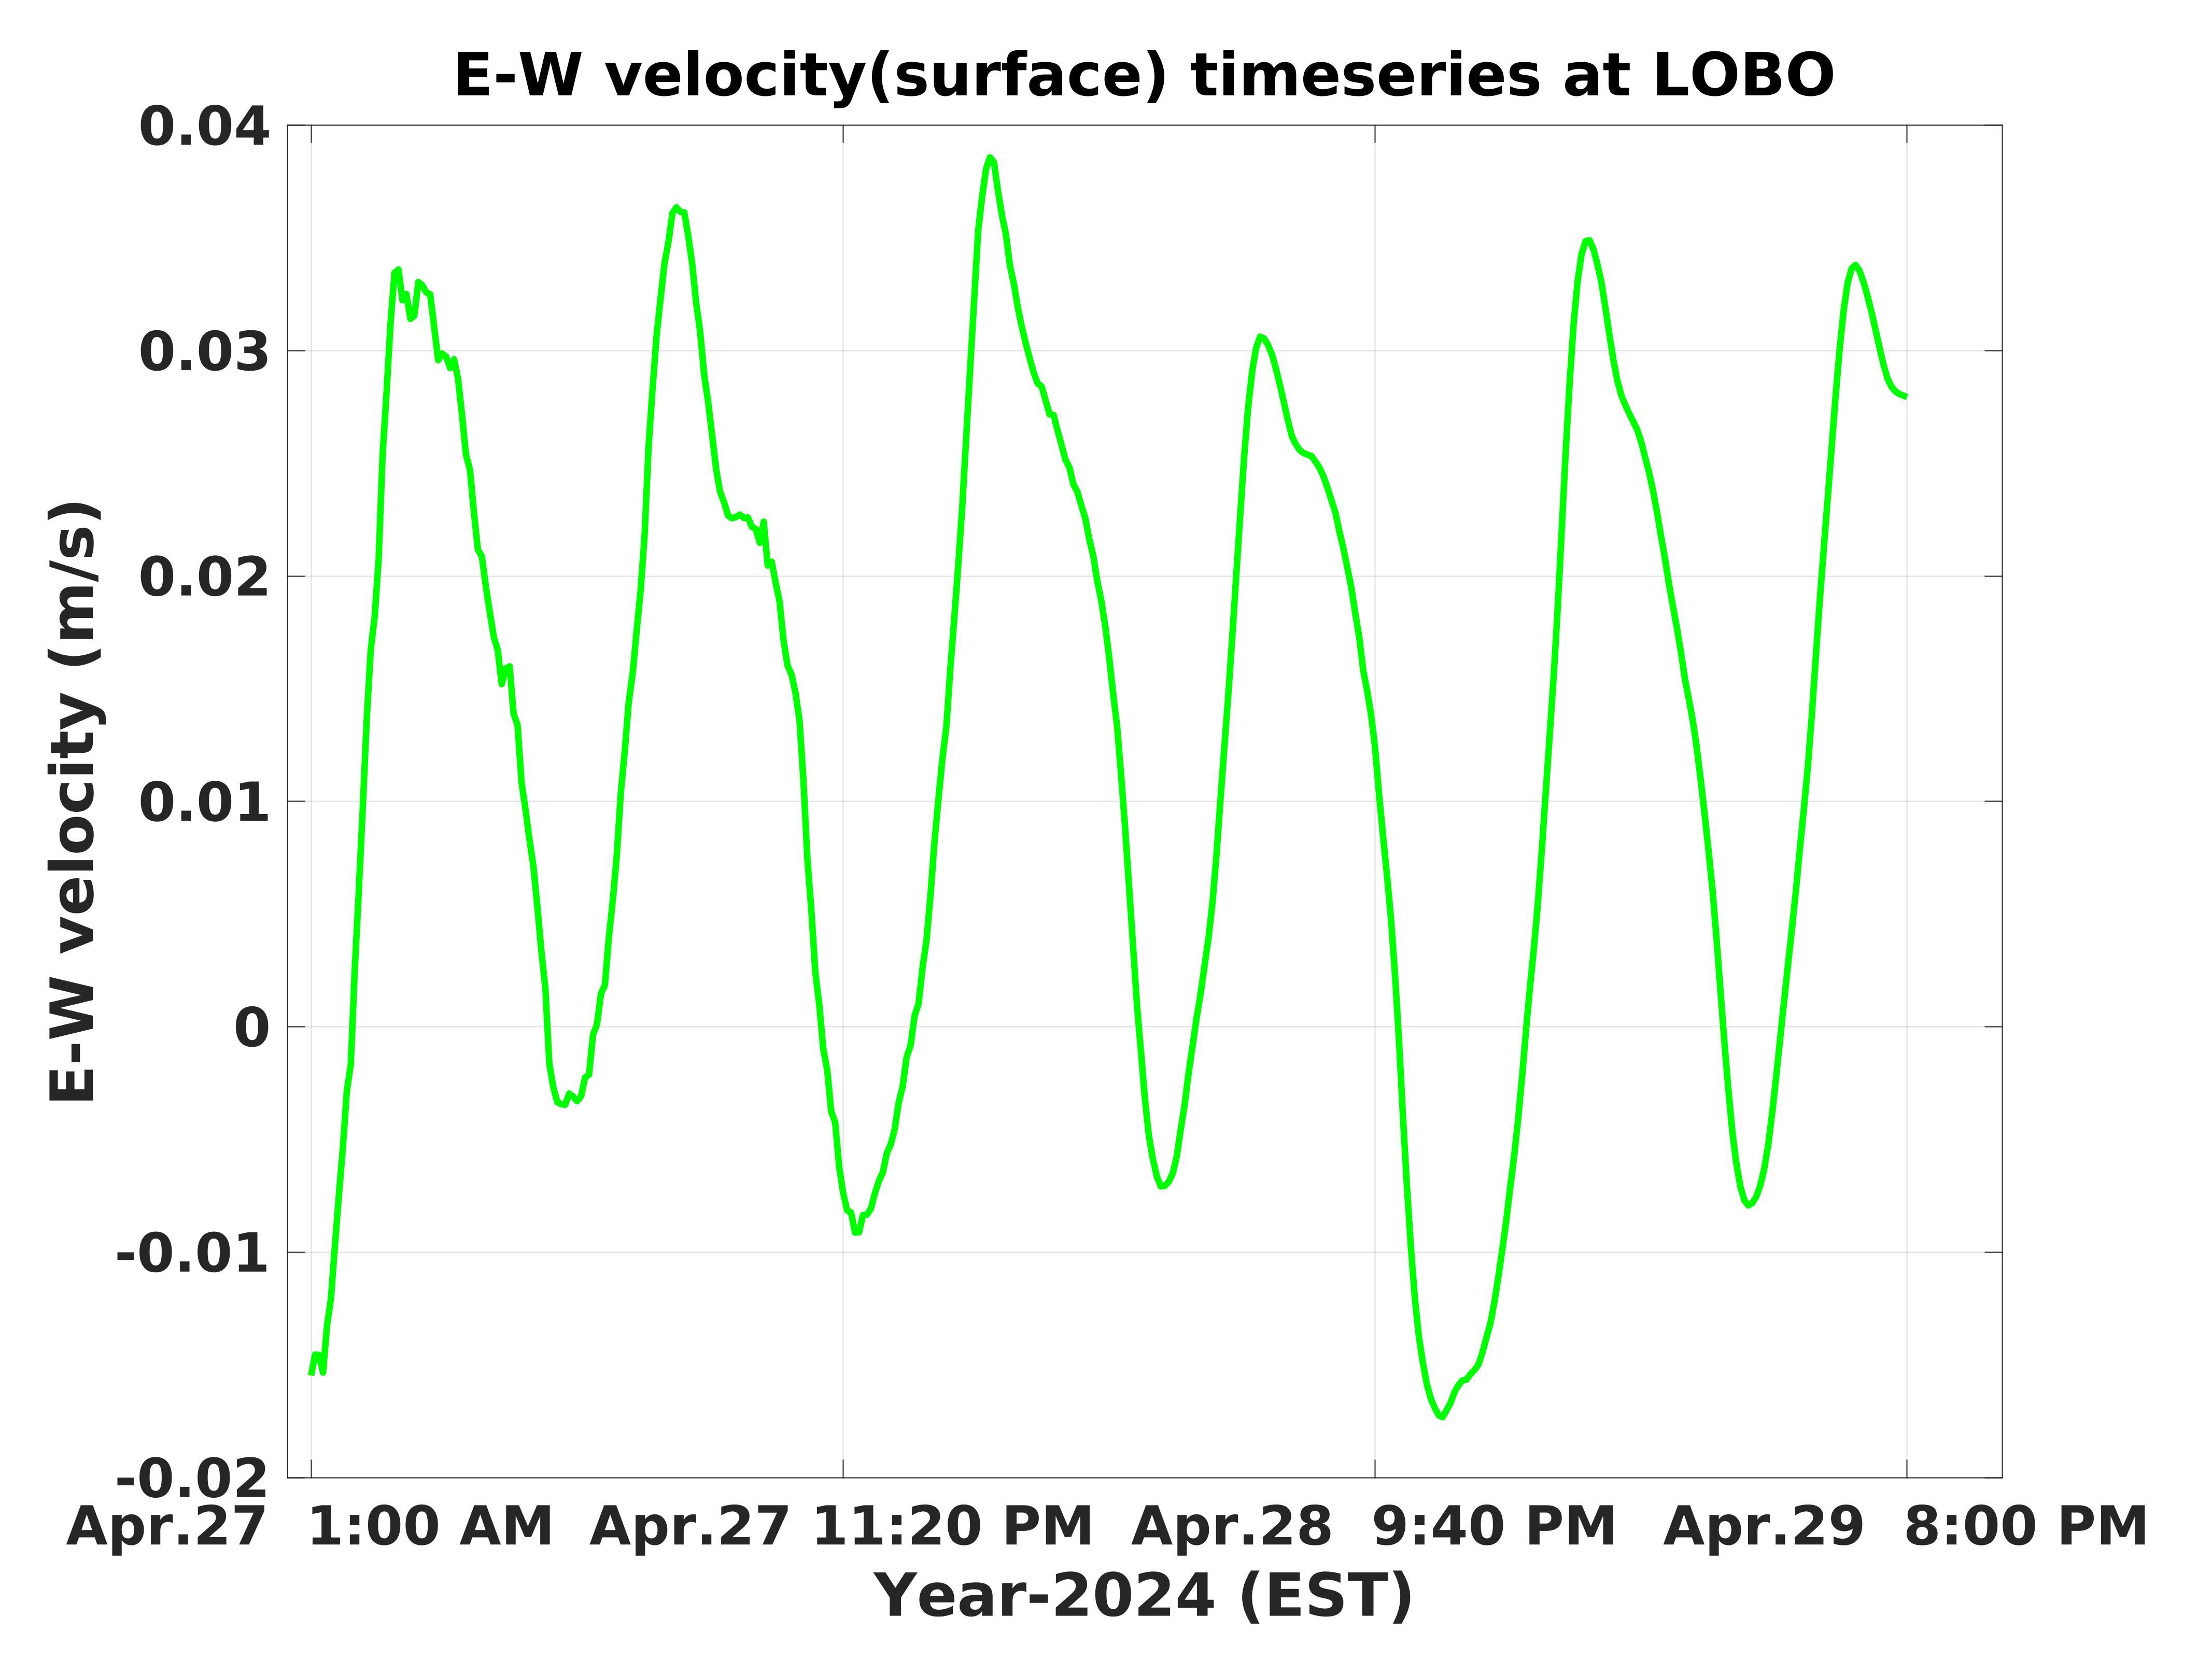
Real Time Forecast
Parameters Predicted
- Water level
- Salinity
- Temperature
- Currents
- Sig Wave Height
- Wave Direction
- Peak Period
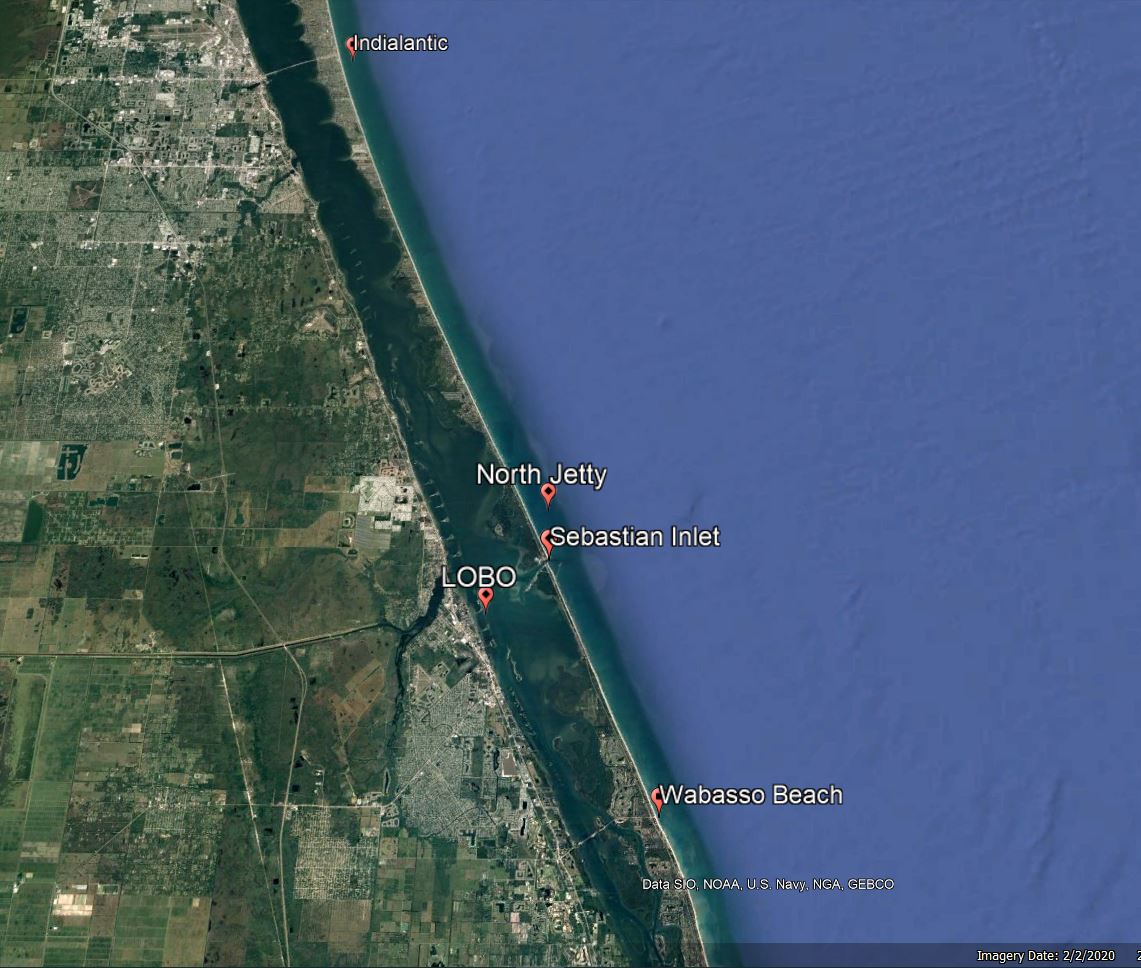
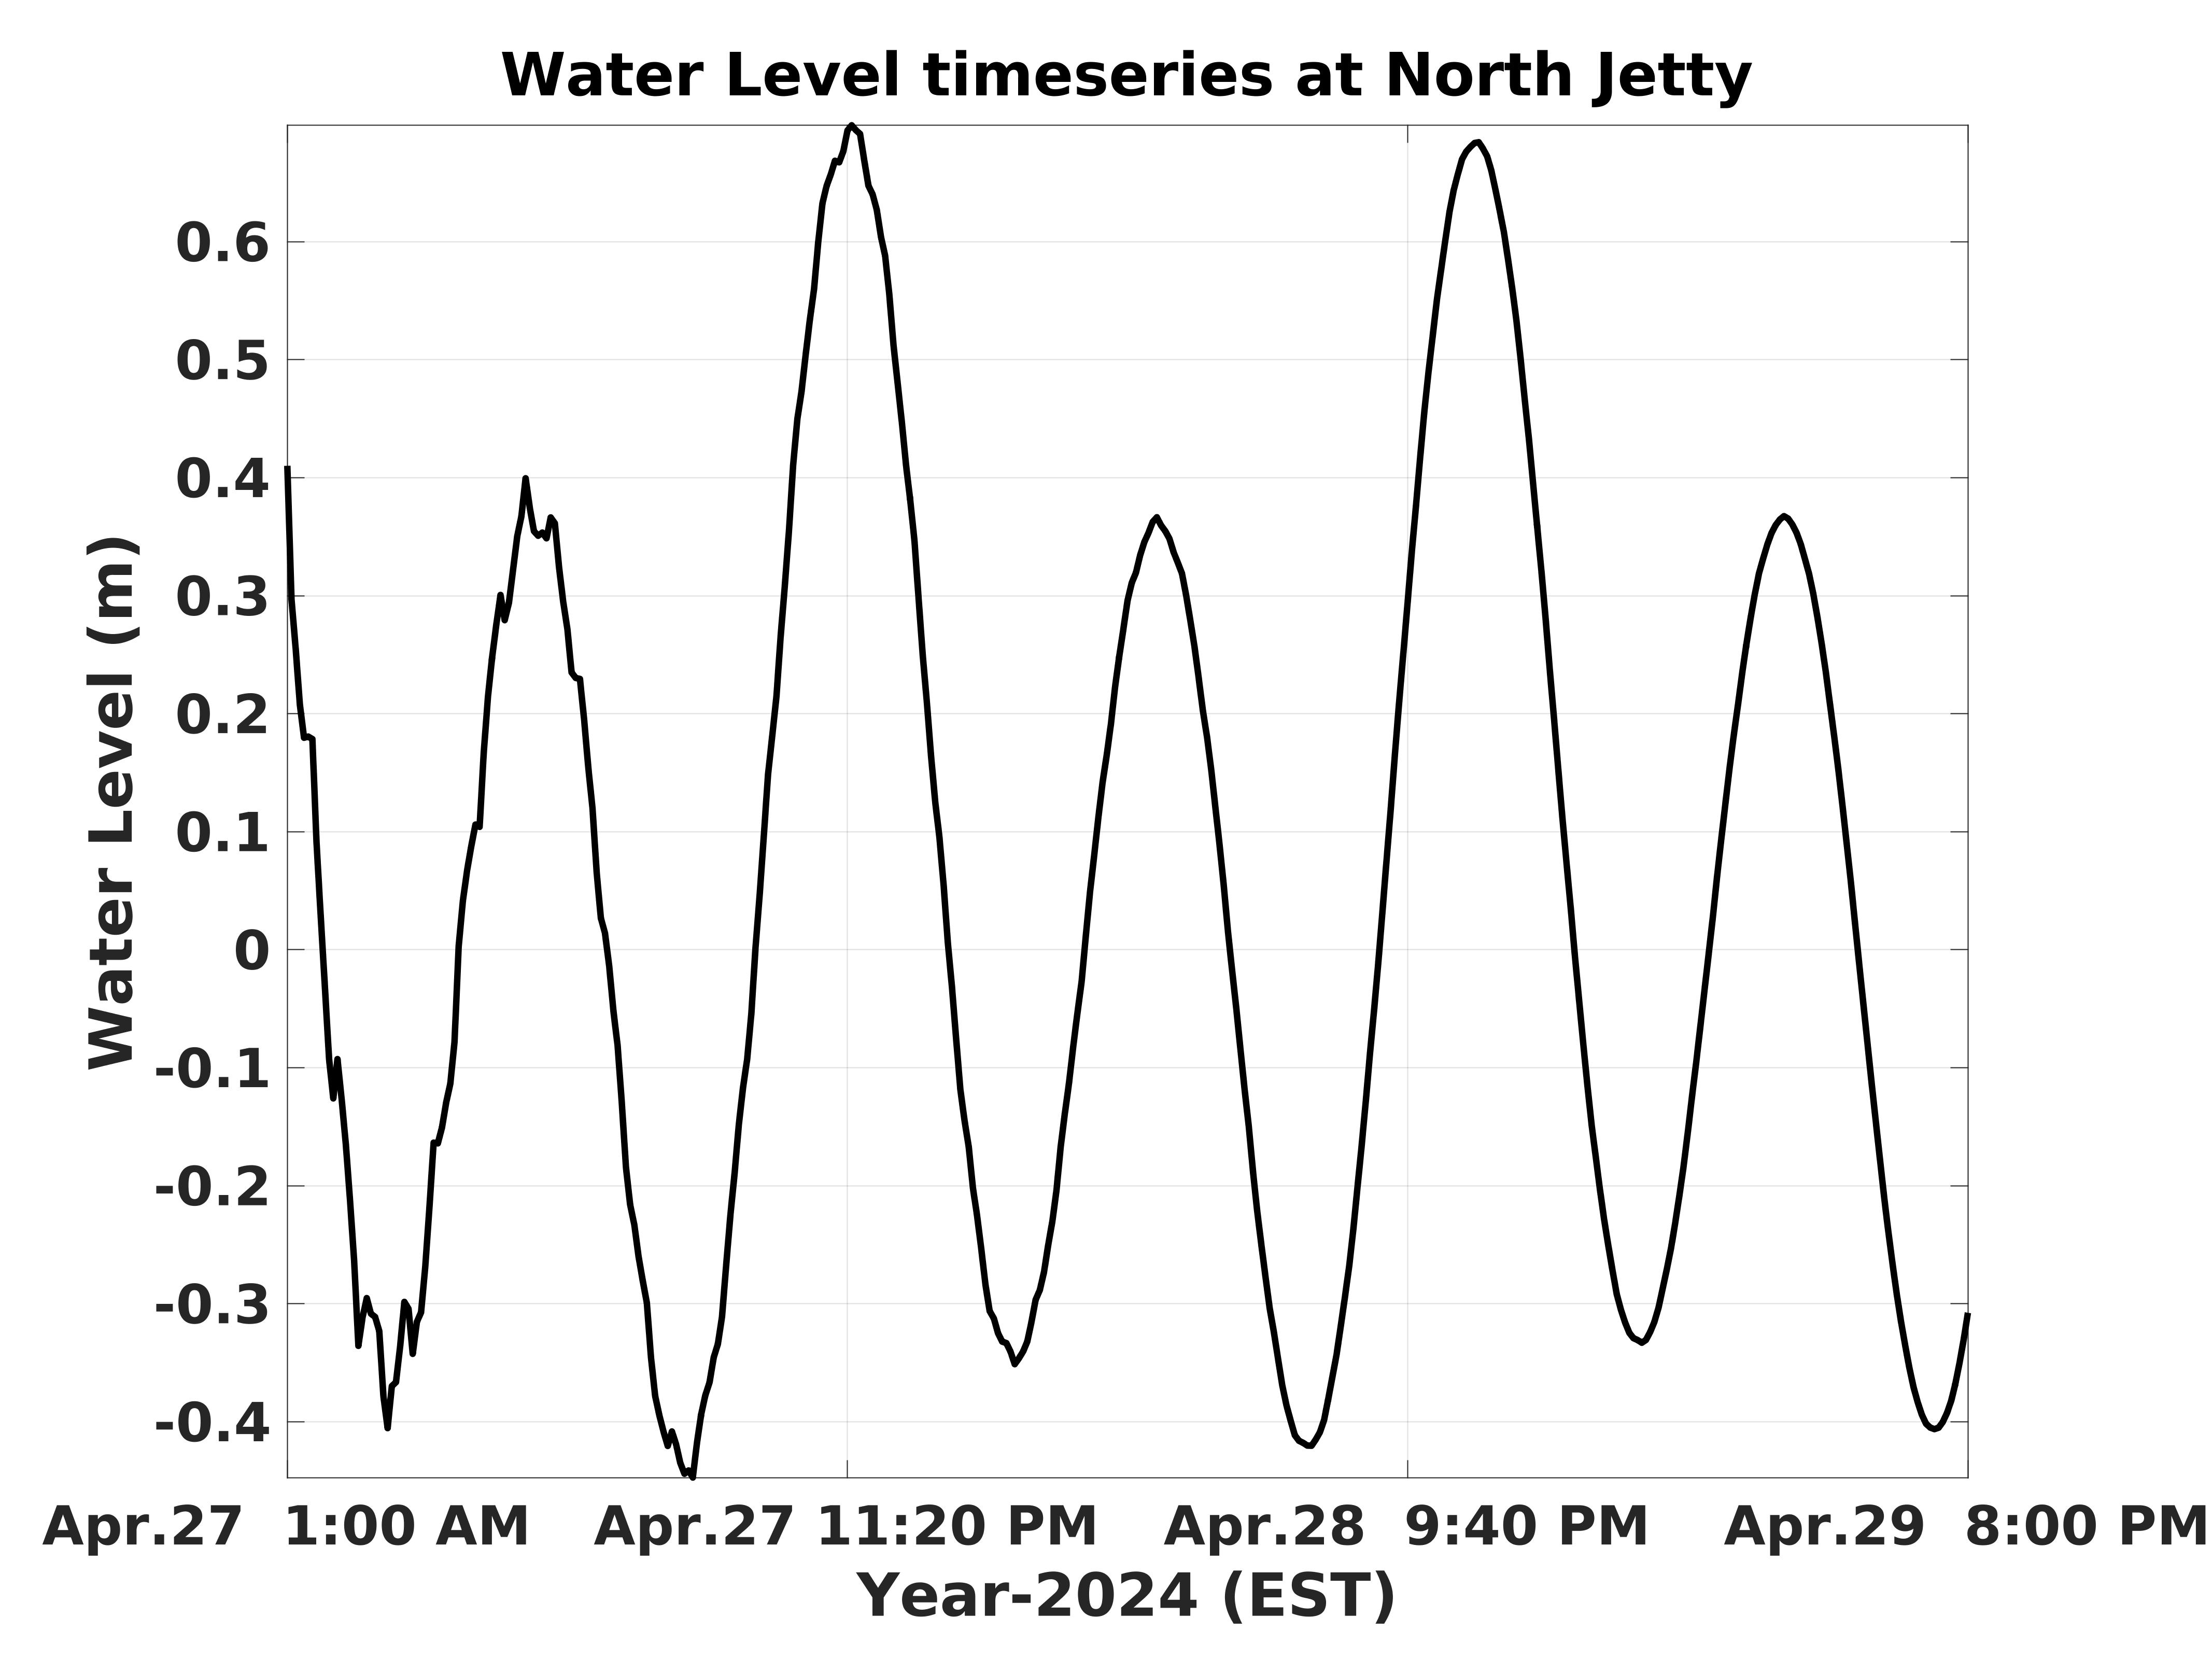
3 days of timeseries forecast data has been provided here for LOBO, Sebastian Inlet, North Jetty, Wabasso Beach, and Indialantic Beach stations.
Developed by
Ahsan Habib, PhD
Dept of Ocean Engineering and Marine Sciences